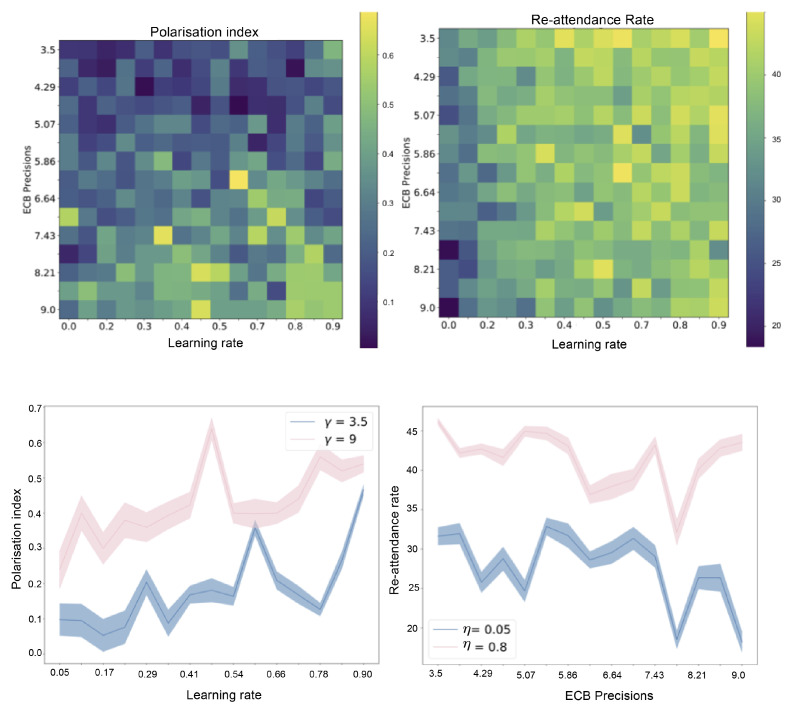
Figure 6.
(Above left) a heatmap of the polarisation index for all 225 combinations of learning rate and epistemic confirmation bias precision. (Above right) a heatmap of the re-attendance rate for all 225 combinations of learning rate and epistemic confirmation bias precision. The parameters represent the centres of the normal distribution sampled from across trials for each configuration. (Below left) the most extreme row of the polarisation index heatmap. (Below right) the most extreme column of the re-attendance rate heatmap.

