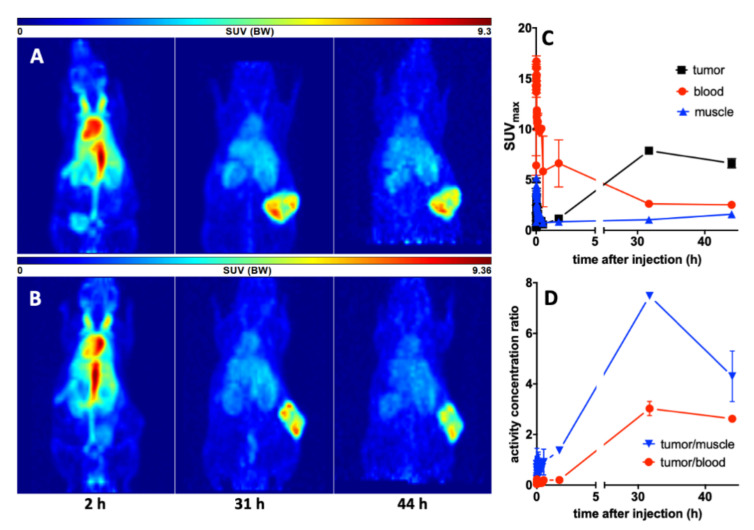
Figure 6.
Imaging and kinetics of the 64Cu-TM distribution in PC3-PSCA/PSMA Luc+ tumor bearing NMRI-Foxn1nu/nu mice. Maximum intensity projections of the PET studies of (A) mouse #1 and (B) mouse #2 at 2, 31, and 44 h after injection of the 64Cu-TM. (C) Activity–concentration–time curves in the tumor, blood, and muscle. (D) Tumor-to-muscle and tumor-to-blood ratios. Values are means ± SEM of two animals.

