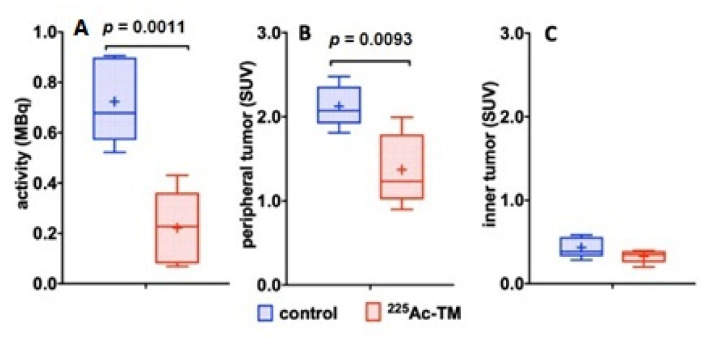
Figure 10.
Quantitative comparison of the 18F-JK-PSMA-7 activity distribution. (A) 18F-JK-PSMA-7 activity amounts in the total tumor (MBq), (B) activity concentrations (SUV) in the periphery of the tumors, and (C) in the central part of the tumors are shown. The box and whiskers plots show mean SUV values for each group indicated as “+” in the control (n = 4) and 225Ac-TM treated group (n = 5).

