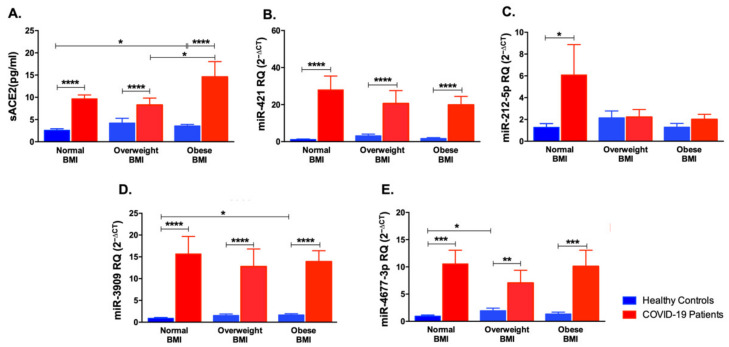
Figure 7.
Impact of BMI variation on sACE2, miR-421, miR-212-5p, miR-3909 and miR-4677-3p levels in COVID-19 patients and healthy controls. (A) sACE2, (B) miR-421, (C) miR-212-5p, (D) miR-3909, and (E) miR-4677-3p were compared in normal, overweight, and obese COVID-19 patients and healthy controls. Data are represented as mean ± standard error of mean (SEM). * p < 0.05, ** p < 0.01, *** p < 0.001, and **** p < 0.0001.

