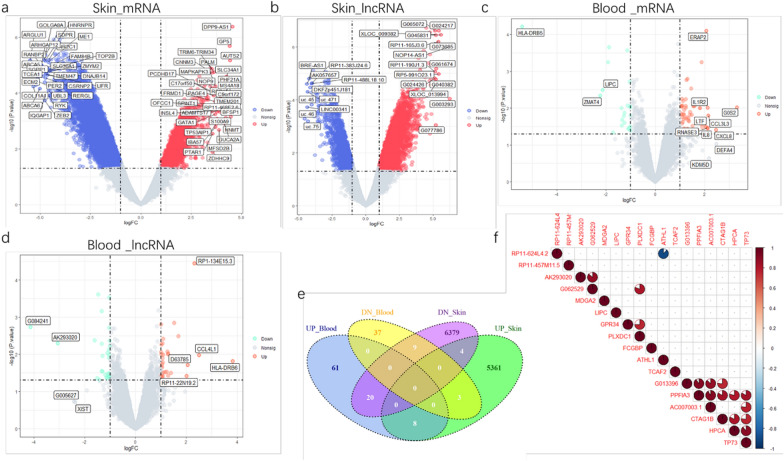
Fig.1.
Gene expression and correlation analysis. The volcano plot illustrates DEGs (including mRNA and lncRNA) between healthy control and pemphigus after analysis of a mRNA of SIMC. b lncRNA of SIMC. c mRNA of PBMC.d lncRNA of PBMC. The y-axis indicates the statistical significance expressed as the log10 of the p-values and the x-axis shows the rate of expression change between experimental groups in log2 base (log2 Fold change), p Value cutoff = 0.05, LogFC cut 1 or – 1. e Authentication of 17 common DEGs in SIMC and PBMC datasets trough Venn diagrams. f Co-expression analysis of common DEGs in SIMC and PBMC. Pairwise correlations based on expression levels were computed for each pair of genes in the matrix shown above. Only genes with a Pearson coefficients value > 0.75 and p value < 0.05 are shown. Positive correlations are indicated in red shades and negative ones in blue shades. DEGs, differentially expressed genes. Nonsig, not statistically significant

