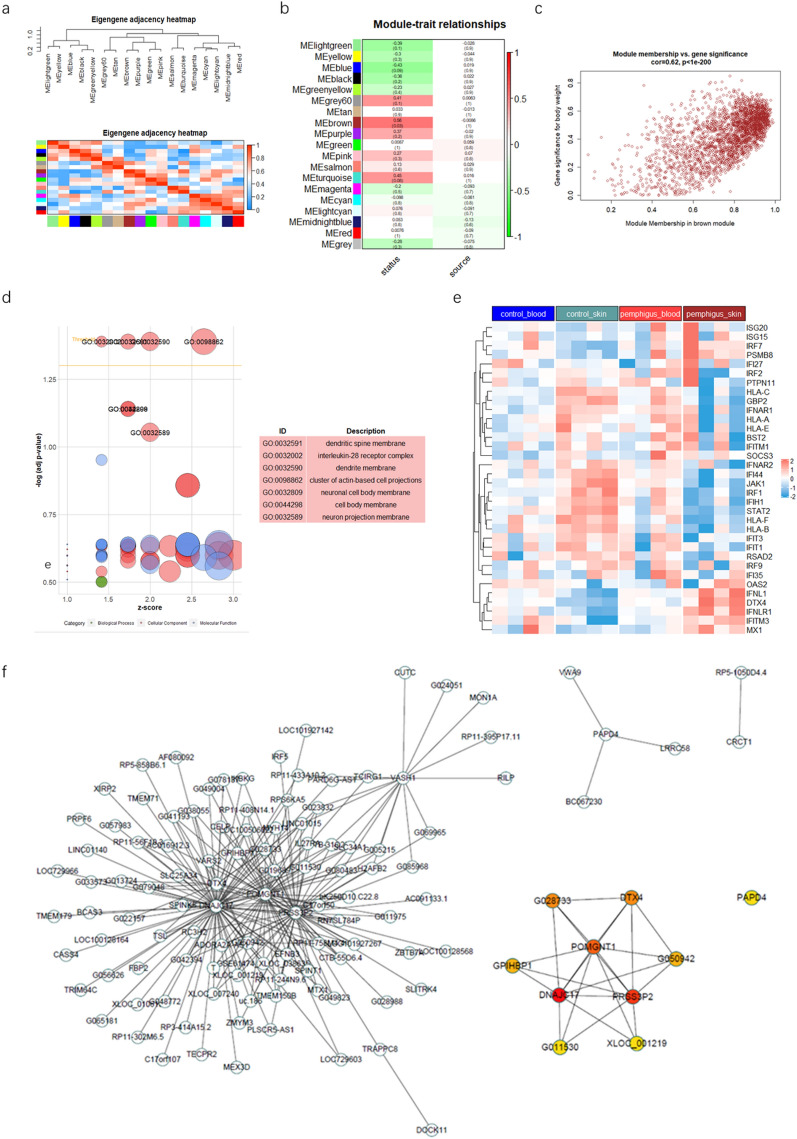
Fig. 5.
Identification and characterization of pemphigus-associated modules using WGCNA. a Eigengene adjacency heatmap shows correlations between modules. b The heatmap to show the correlation between module eigengenes and disease status or sample
source relationship of 19 modules. P-value is shown in brackets. Status: disease status. Source: sample source. c the scatter plot of module eigengenes in brown module. d GO enrichment result of brown module genes. e heatmap of genes associated to type I IFN signaling pathway.f the protein–protein interaction network of genes in brown module. Ten hub genes identified by the ‘cytoHubba’ plugin via mixed character calculation. The significance of hub genes increases with increasing intensity of the dot color

