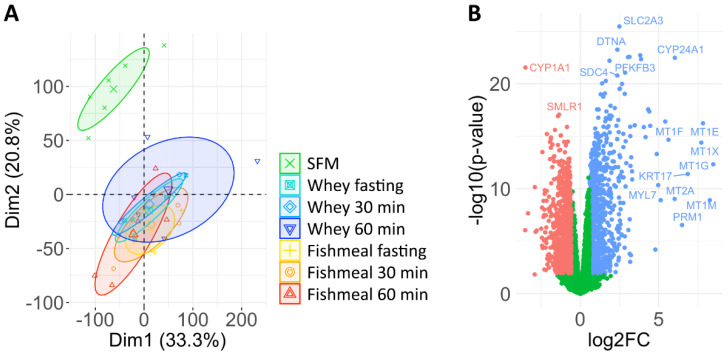
Figure 3.
The gene expression profile of HepG2 cells incubated with or without human serum. (A) Principal component analysis of the gene expression (log2TPM) displaying the first two components. HepG2 cells were incubated with serum-free medium, medium supplemented with 20% human serum from fasting participants, or medium supplemented with serum taken 30 or 60 min after the intake of fishmeal or whey (n = 5–6 per condition; Figure 1). (B) Differential gene expression analysis of cells incubated with serum from fasting participants versus cells cultured in serum-free medium. Genes that were >1.5-fold up- or downregulated (fdr < 0.05) are indicated in blue or red, respectively. SFM: serum-free medium.

