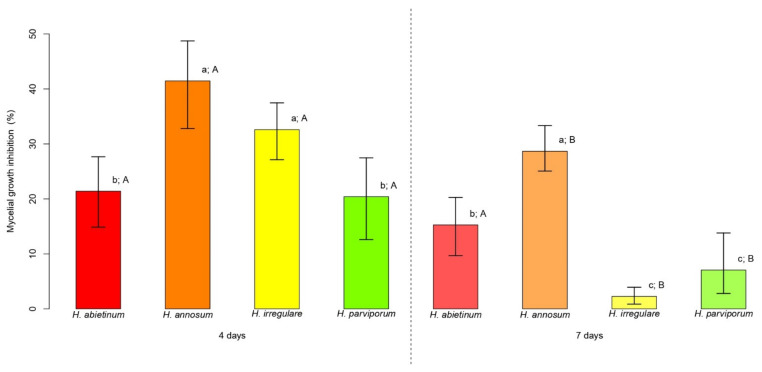
Figure 1.
Mycelial growth inhibition (MGI) comparisons. For each time point (4 and 7 days) bars indicate the average MGI displayed by the four species of Heterobasidion. Error bars refer to the lower and upper bounds of the 95% confidence interval. Above each bar, lowercase letters refer to the comparisons of average MGI values among Heterobasidion species for each time point, while upper case letters refer to the comparison of the two time points for the same species. Different letters indicate significant differences (p < 0.05).

