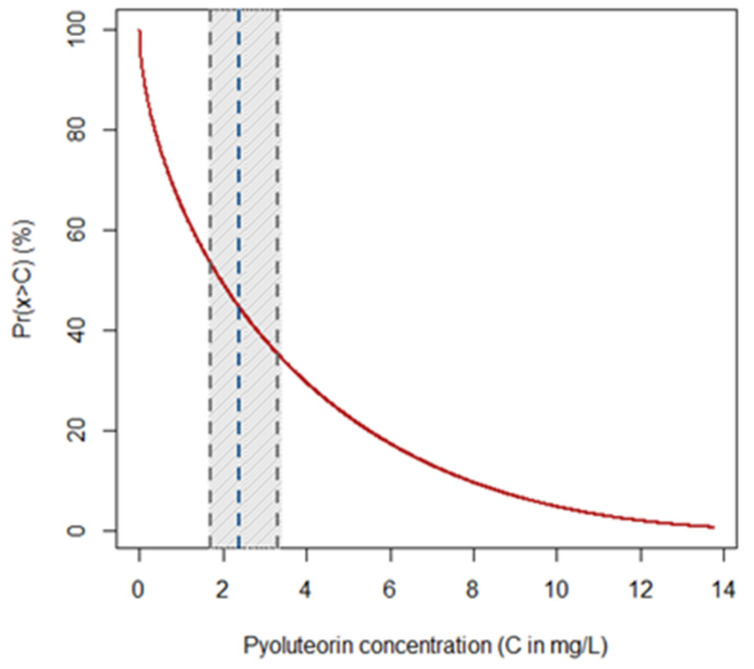
Figure 2.
Probability of retrieving pyoluteorin (PLT) from monocultures of P. protegens (strain DSMZ 13134) with concentrations over a given threshold. The graph shows the thresholds C of PLT concentration (in mg/L) on the x-axis, while the y-axis reports the probability ( in %) that P. protegens (strain DSMZ 13134) may release higher concentrations of the compound. The red curve quantifies the probability, while the blue dashed lines represent the average expected concentration of PLT along with the lower and upper bounds (gray dashed lines) of its 95% confidence interval (gray strip).

