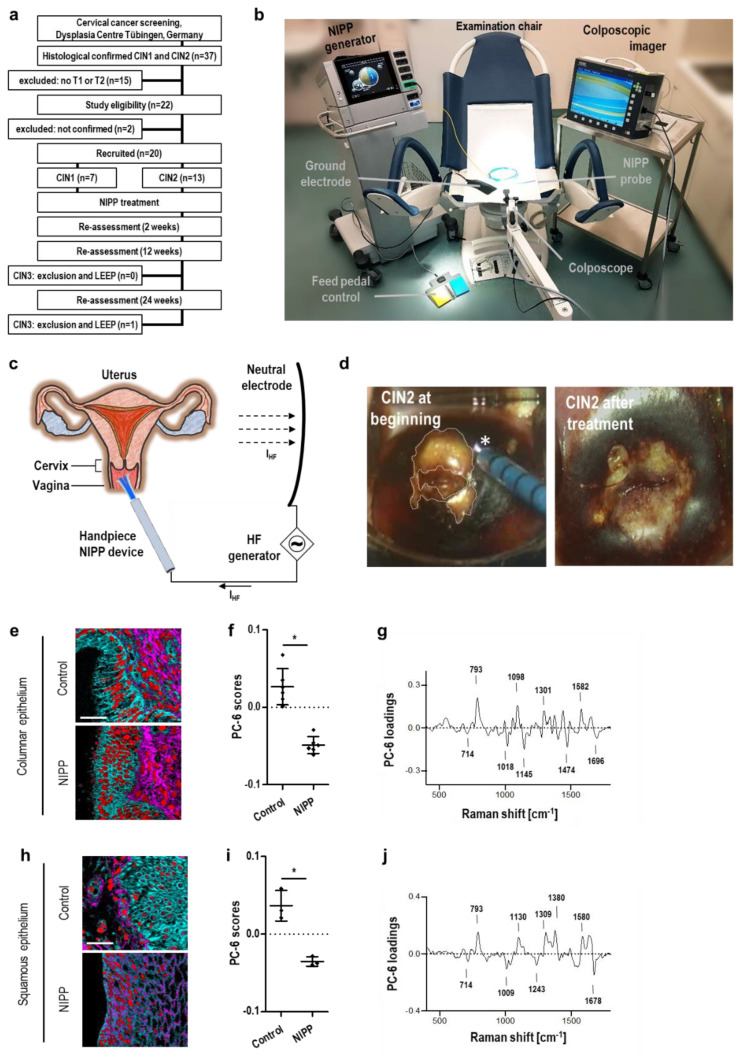
Figure 3.
In vivo NIPP treatment and evaluation of molecular tissue effects, penetration depth and clinical efficacy. (a) Trial flow chart of patient recruitment and study visits for the prospective clinical study. (b) Setup of in vivo NIPP treatment. (c) Schematic of the anatomical view of the human cervix. As the uterine portion of the vaginal cavity, the cervix is easily accessible for NIPP treatment. (d) Colposcopic image of a human cervix after staining with 4% acetic acid and Lugol’s iodine at beginning (left) and after (right) NIPP treatment (30 s/cm2). The transformation zone is completely visible (T1 transformation zone; dashed line). The NIPP effluent is marked by an asterisk. (e–j) Columnar (e–g) and squamous (h–j) epithelium of tissue sections from patients treated with NIPP in vivo at 30 s/cm2 and tissue biopsies before treatment (control) were analyzed by Raman imaging. (e,h) Nuclei (red), collagen I (pink) and cytoplasmic proteins (light blue) were localized by TCA; the scale bar equals 50 μm. (f,i) The nuclear spectra obtained in (e,h) were processed by PCA, and the average PC score values of each patient (◆) were statistically compared (mean ± SD; paired t test; * p < 0.05). (g,j) Underlying biochemical information was interpreted based on relevant spectral signatures elaborated in the loading plot.

