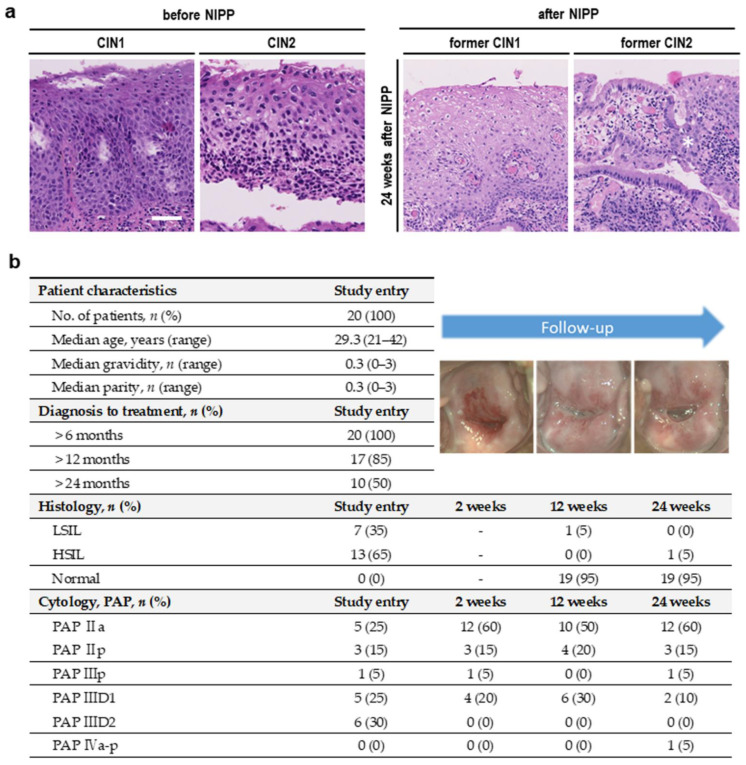
Figure 4.
Study results. (a) Representative histopathological images of a CIN1 a CIN2 lesion before and 24 weeks after NIPP treatment within the prospective clinical study; the scale bar equals 50 μm; the asterisk marks the junction between squamous and columnar epithelium. (b) Clinical, histopathological and cytological features of patients before and 2, 12 and 24 weeks after NIPP treatment.

