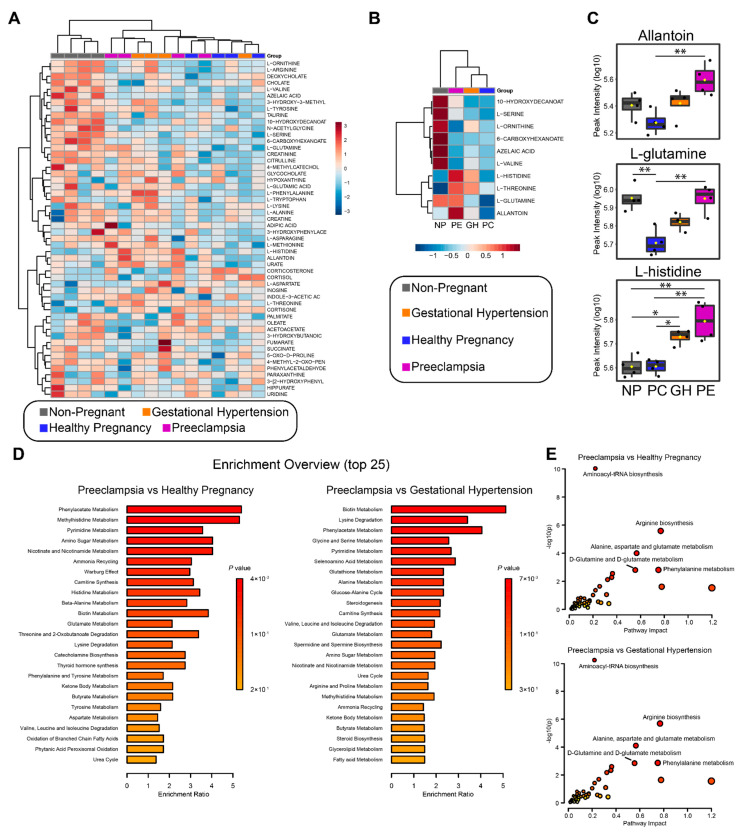
Figure 6.
Metabolomics analysis from non-pregnant (NP), healthy pregnancy (PC), gestational hypertension (GH), and preeclampsia (PE) patients. Hierarchical clustering and heatmap of all the identified metabolites per sample (A) and the statistically changing metabolites as determined by ANOVA and Tukey’s HSD (B). Distance measure = euclidean and clustering algorithm = ward.D. (C) Allantoin, L-glutamine, and L-histidine intensity as determined by LC-MS and represented by boxplot. Statistical analysis performed with ANOVA and Tukey’s HSD. p < 0.05 (*) or p < 0.01 (**) were considered significant. (D) Quantitative enrichment analysis (QEA) of all the identified metabolites. Enrichment ratio was computed by hits/expected (hits = observed hits; expected = expected hits). (E) Joint-pathway analysis of the metabolomics and proteomics data. All the proteins and metabolites identified by each methodology were submitted to the analysis, along with their fold-change. Enrichment was performed via hypergeometric test, topology measure was set to degree centrality, and combined queries was the integration method.

