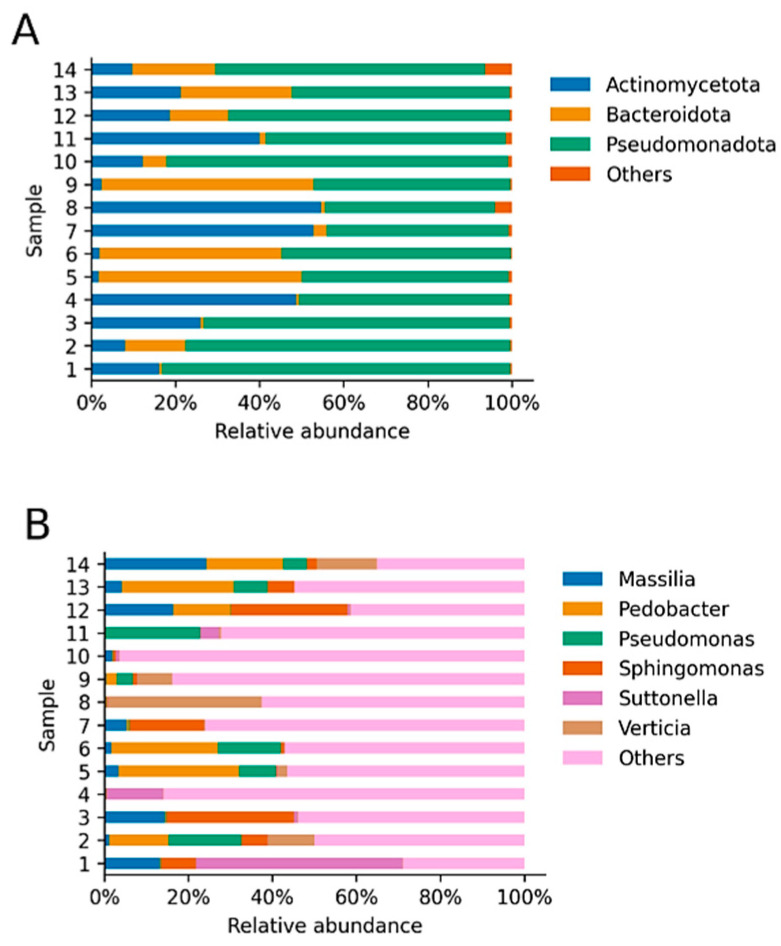
Figure 2.
Relative abundance of taxa (A). Relative abundance of the most abundant identified phyla. Reads derived from both eyes were combined and phyla with an average relative abundance lower than 1% were labeled as “others”. The three plotted phyla represent 98.72% on average of the total relative abundance of all samples. (B). Relative abundance of the most abundant identified genera. Reads derived from both eyes were combined and genera with an average relative abundance lower than 5% were labeled as “others”. The six plotted genera represent 36.59% on average of the total relative abundance of each sample. The “other” genera represent 63.41% on average (Supplementary Table S1).

