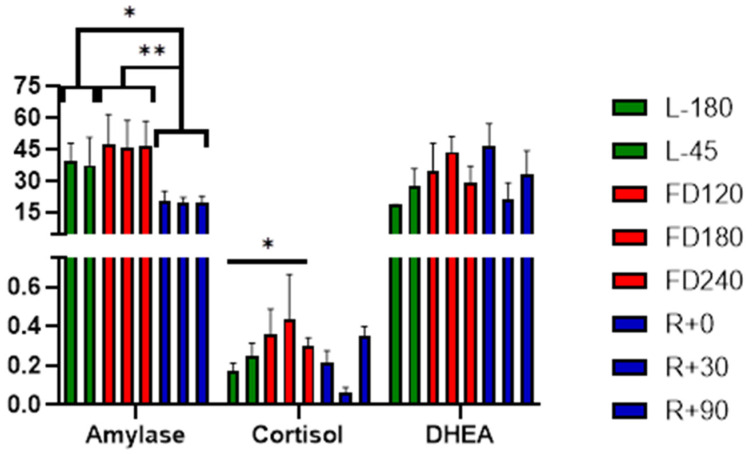
Figure 2.
Mean distribution of salivary alpha amylase, cortisol, and DHEA before (green), during (red), and after (blue) the mission. Pre-mission samples are indicated by “L-“ referencing the number of days before launch. In-flight mission samples are indicated as FD, flight day. Post-mission samples are similarly indicated by “R+” for the days post-return. Statistical significance is indicated by * p < 0.05 and ** p < 0.01.

