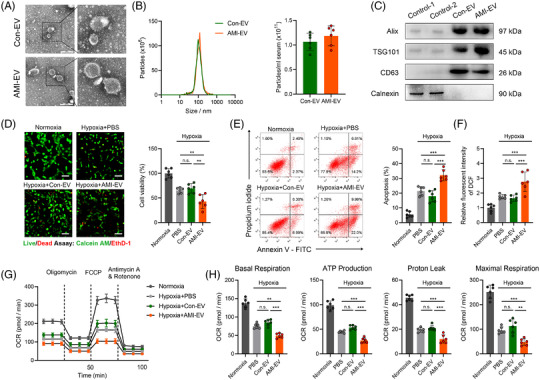
FIGURE 1.

Characterisation and functional validation of acute myocardial infarction (AMI) serum extracellular vesicles (EVs) in human cardiomyocytes AC16. (A) Representative transmission electron micrograph of isolated vesicles from the serum of AMI patients and control patients. Scale bar: 100 nm. (B) Representative images of nanoparticle tracking analysis reflecting the size distributions of isolated vesicles and average concentrations of serum EVs in the AMI and control groups. (C) Representative blot images of exosomal markers (Alix, TSG101, CD63) and the contamination marker calnexin. (D) Fluorescence staining with calcein‐AM (green) vital dyes represents living cells, and ethidium homodimer‐1 staining (red) represents dead cells in the indicated groups. The percentage of cell viability is shown in the right panels. Scale bar: 100 μm. (E) Flow cytometry analysis of Annexin V‐APC and PI fluorescence in AC16 cells incubated with EVs. (F) The effect of EVs on AC16 cell reactive oxygen species (ROS) production was measured using a fluorescence microplate reader to determine the fluorescence intensity of 2,7‐dichlorodihydrofluorescein diacetate (DCF). (G) Cellular oxygen consumption rate (OCR) levels at the indicated times from the basal level following the presence of the indicated drugs. Oligomycin, carbonyl cyanide 4‐(trifluoromethoxy) phenylhydrazone (FCCP), antimycin A, and rotenone. (H) Indices of mitochondrial respiration calculated according to the OCR profiles: basal respiration, adenosine triphosphate (ATP) production, proton leakage, and maximal respiration in AC16 cells. (n = 6; **P < 0.01; ***P < 0.001)
