FIGURE 2.

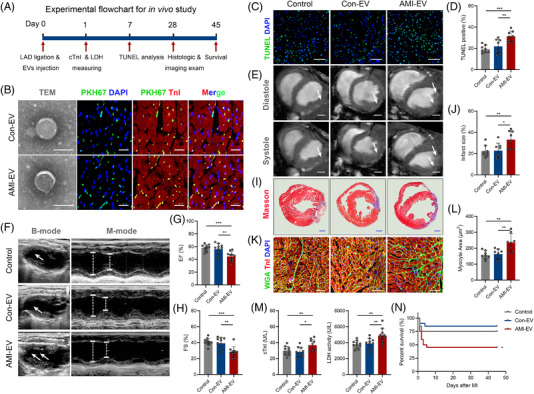
Extracellular vesicles (EVs) isolated from the serum of acute myocardial infarction (AMI) mice with exacerbated myocardial injury and cardiac dysfunction. (A) Flowchart of the in vivo studies. (B) Left, representative transmission electron micrograph of isolated vesicles from the serum of the myocardial infarction (MI) group and sham groups. Scale bar: 100 nm. Right, confocal microscopy images of PKH67‐labelled (green) EVs taken by cTnI+ (red) cardiomyocytes. Scale bar: 100 μm. (C) TUNEL immunofluorescence staining identifies apoptotic cells, followed by DAPI staining to visualise nuclei. Scale bar: 100 μm. (D) Quantification of TUNEL‐positive cardiomyocytes is shown in the right panels (n = 8). (E) Representative cardiac magnetic resonance images (MRI) of two‐chamber short‐axis views at the end of diastole and systole. Scale bar: 1 mm. (F) Cardiac function measured by echocardiography 28 days after MI onset. (G, H) The percentage of left ventricular ejection fraction (EF) and fractional shortening (FS) is shown in the right panels (n = 10). (I) Representative images of cardiac sections with Masson's trichrome staining at 28 days after MI onset. Scale bar: 1 mm. (J) The quantification of infarct size is shown (n = 8). (K) Wheat germ agglutinin (WGA) dye was used for the border zone of the infarct sections to identify the cardiomyocyte size, followed by cTnI immunofluorescence staining for visualising cardiomyocytes and DAPI staining for visualising nuclei. Scale bar: 100 μm. (L) Quantification of the cardiomyocyte size area (n = 8). (M) Serum cTnI levels and lactic acid dehydrogenase (LDH) activity at one day after MI onset (n = 10). (N) The mouse survival rate was analysed after EV injection (n = 20). (*P < 0.05; **P < 0.01; ***P < 0.001)
