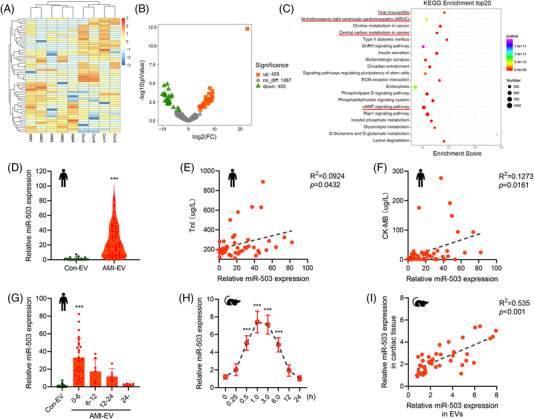
FIGURE 3.

Dysregulation of miR‐503 in acute myocardial infarction (AMI) circulating extracellular vesicles (EVs). (A) Exosomal small RNA sequences from AMI (n = 5) and control (n = 4) patients are presented in the heatmap. (B) The expression change profiles of exosomal miRNAs from the AMI patients and control groups are presented in the volcano plot. (C) Analysis of the Kyoto Encyclopedia of Genes and Genomes (KEGG) for the predicted target genes of the upregulated miRNAs from small RNA sequences. (D) Real‐time quantitative polymerase chain reaction (qRT–PCR) analysis of miR‐503 expression in serum EVs from the AMI and control groups. (E) Correlation analysis between exosomal miR‐503 expression and serum TnI levels. (F) Correlation analysis between exosomal miR‐503 expression and serum CK‐MB levels. (G) Levels of miR‐503 in the indicated period in post myocardial infarction (MI) patients. (H) qRT–PCR analysis of the levels of miR‐503 in the indicated period in post‐left anterior descending (LAD) ligation mice (n = 5). (I) Correlation analysis between exosomal miR‐503 levels and cardiac miR‐503 expression in mice after LAD ligation. (***P < 0.001)
