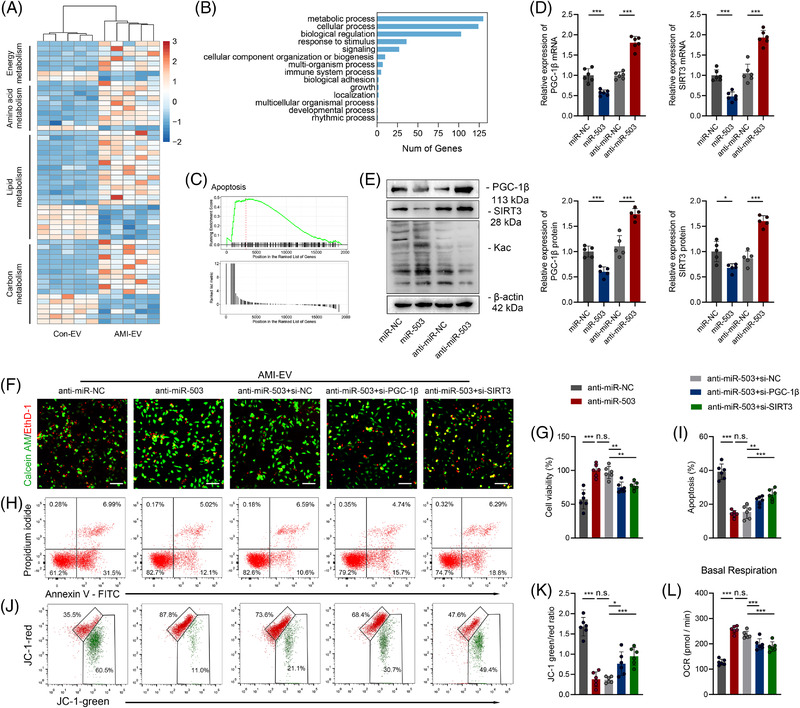
FIGURE 5.

Identification of PGC‐1β and SIRT3 as functional target genes downstream of miR‐503. (A) Heatmap of metabolism‐related differentially expressed genes identified from RNA‐sequencing analysis in mice after left anterior descending (LAD) ligation treated with extracellular vesicles (EVs) from acute myocardial infacrtion (AMI) (AMI‐EV) mice or the control group (Con‐EV). (B) Top 10 KEGG pathways that show differentially expressed genes enriched in cardiac tissue between the Con‐EV and AMI‐EV groups. (C) Gene set enrichment analysis (GSEA) of the apoptosis pathway in the AMI‐EV versus Con‐EV groups. (D) Real‐time quantitative polymerase chain reaction (qRT–PCR) analysis of PGC‐1β and SIRT3 expression in cardiomyocytes transfected with miR NC, miR‐503, anti‐miR‐NC, or anti‐miR‐503. (E) Western blot images reflecting PGC‐1β and SIRT3 protein levels and global acetylation levels in cardiomyocytes transfected with miR‐503 or anti‐miR‐503. (F, G) Calcein‐AM staining (green) and ethidium homodimer‐1 staining (red) for cardiomyocytes transfected with siRNAs and anti‐miR‐503 followed by treatment with AMI‐EVs. Scale bar: 100 μm. (H, I) Flow cytometry analysis of Annexin V‐APC and PI fluorescence in the indicated groups. (J, K) Mitochondrial membrane depolarisation level analysed by JC‐1 staining in the indicated groups. (L) Basal respiration calculated by an XF24 Extracellular Flux Analyser. (n = 6; *P < 0.05; **P < 0.01; ***P < 0.001)
