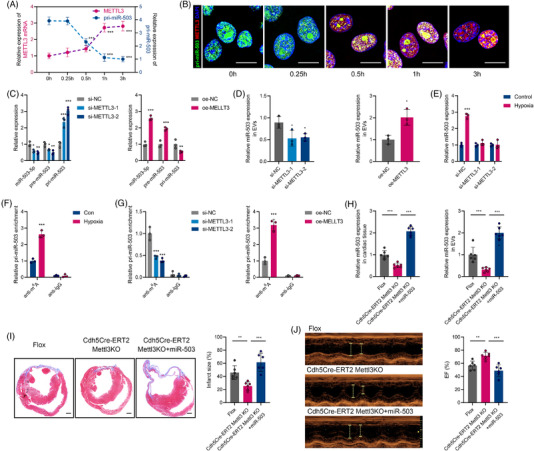
FIGURE 7.

METTL3 could mediate pri‐miR‐503 maturation by N6‐methyladenosine under hypoxia. (A) Real‐time quantitative polymerase chain reaction (qRT–PCR) analysis of pri‐miR‐503 and METTL3 mRNA expression in mouse arterial endothelial cells (MAECs) under hypoxia at the indicated time points. (B) Colocalisation analysis between pri‐miR‐503 and METTL3 was detected by RNA fluorescence in situ hybridization (FISH) and immunofluorescence staining for MAECs under normoxia or hypoxia. Nuclei were stained with DAPI. Scale bar: 20 μm. (C) qRT–PCR analysis of pri‐miR‐503, pre‐miR‐503, and miR‐503 expression in MAECs transfected with si‐METTL3 or METTL3 overexpression plasmid. (D) Endothelial exosomal miR‐503 expression after si‐METTL3 or oe‐METTL3 transfection. (E) qRT–PCR analysis of pri‐miR‐503, pre‐miR‐503, and miR‐503 expression in MAECs transfected with si‐METTL3 under normoxia or hypoxia. (F) Analysis of m6A modification on pri‐miR‐503 by immunoprecipitation with an anti‐m6A antibody and qRT–PCR in MAECs under normoxia or hypoxia. (G) Analysis of m6A modification on pri‐miR‐503 by immunoprecipitation with an anti‐m6A antibody and qRT–PCR in MAECs transfected with si‐METTL3 or oe‐METTL3. (H) The expression of miR‐503 in EVs and cardiac tissue was analysed in endothelial Mettl3 conditional knockout (cKO) mice, cKO mice treated with miR‐503, and littermate controls after myocardial infarction (MI) onset. (I) Representative images of cardiac sections with Masson's trichrome staining at 28 days after MI onset in the respective groups (left). Scale bar: 1 mm. The quantification of infarct size is shown (right). (J) Echocardiography assay analysis of cardiac function after MI onset in the respective groups (left). The percentage of left ventricular ejection fraction (EF) is shown (right). (n = 3 for in vitro studies and n = 6 for in vivo studies; *P < 0.05; **P < 0.01; ***P < 0.001)
