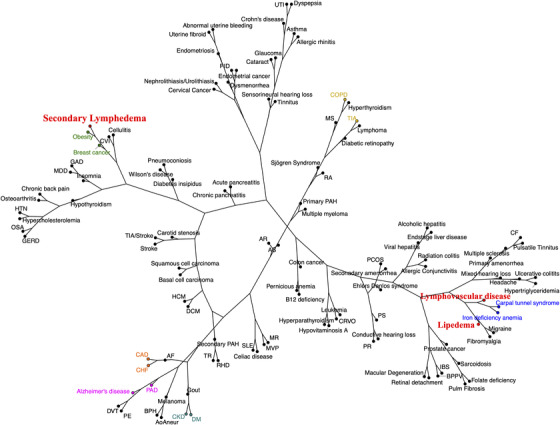
FIGURE 6.

Disease network dendrograms: lymphatic groups. The disease network dendrogram for those with a lymphatic disorder is significantly different thanthe control network in Figure 5 (p < .001). The lymphatic network is more expansive, with distinct disease re‐ordering. The three lymphatic disease categories are designated in red. Representative disease pairs are highlighted in identical color schemes as in Figure 5 network, for visual comparison
