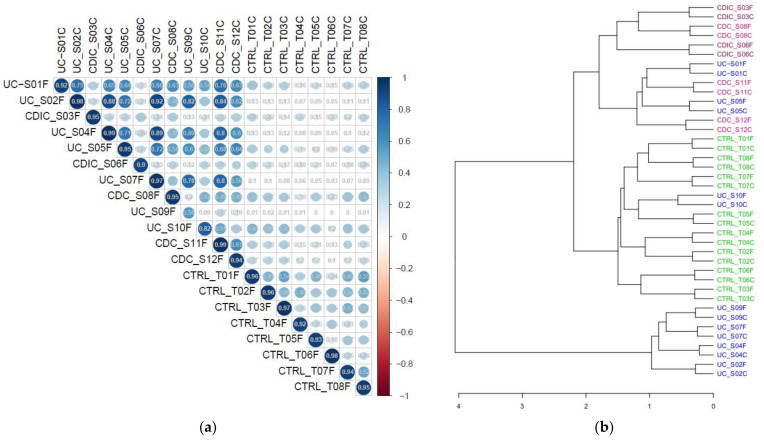
Figure 1.
(a) Pearson’s correlation between metaproteomic profiles (abundance of each of the 43 521 subgroups) of fresh (suffixed with F) and frozen (suffixed with C) samples. (b) Clustering of samples based on their subgroup abundances. CTRL: controls (8 pairs of fresh/frozen samples); CDC: Colonic Crohn’s disease (3 pairs of fresh/frozen samples); CDIC: Ileo-Colonic Crohn’s disease (2 pairs of fresh/frozen samples); UC: Ulcerative Colitis (7 pairs of fresh/frozen samples). Samples UC_S10, which clustered with controls, corresponded with low inflammation.

