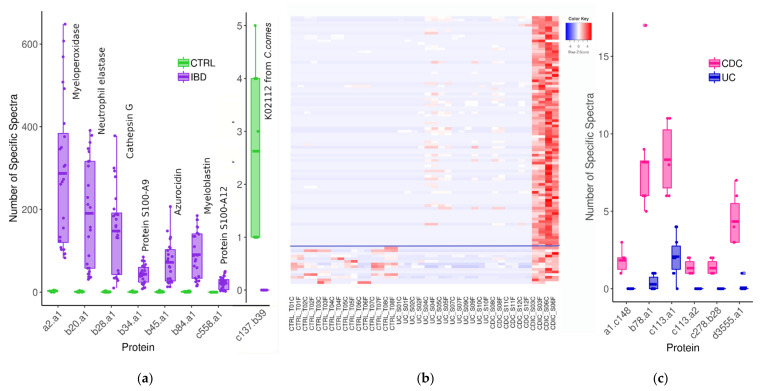
Figure 4.
(a) Protein subgroups over- and underrepresented in all IBD samples compared to all controls. (b) Heatmap of 101 subgroups overabundant in CDIC samples compared to all other IBD samples (see Table S5 for their complete list); 87 of them (over the blue line) were also overabundant compared to controls (data are log-transformed and zero-centred). (c) Protein subgroups overabundant in all CDC compared to all UC samples. Abbreviations and headcounts of patient groups are those detailed in legend of Figure 1.

