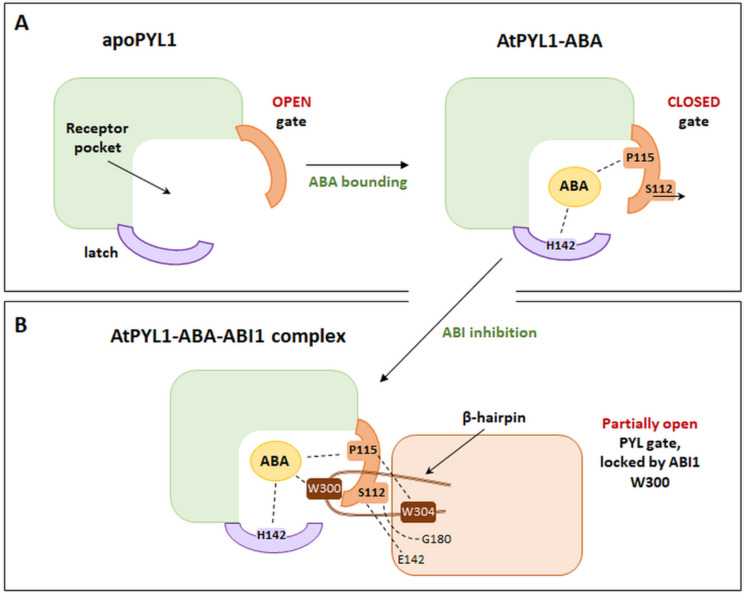
Figure 5.
Schematic representations: (A). The AtPYL1-ABA complex, highlighting main amino acids involved in the interaction with ABA: S112, P115, and H142. (B). The AtPYL1-ABA-ABI1 complex, illustrating the most important amino acid positions of ABI1, involved in the interaction with AtPYL1-ABA (W300, W304, E142, and G180). (Modified from [77]).

