
Figure 2. Pattern of systemic inflammation in DIAMOND mice as they age on a regular chow diet.
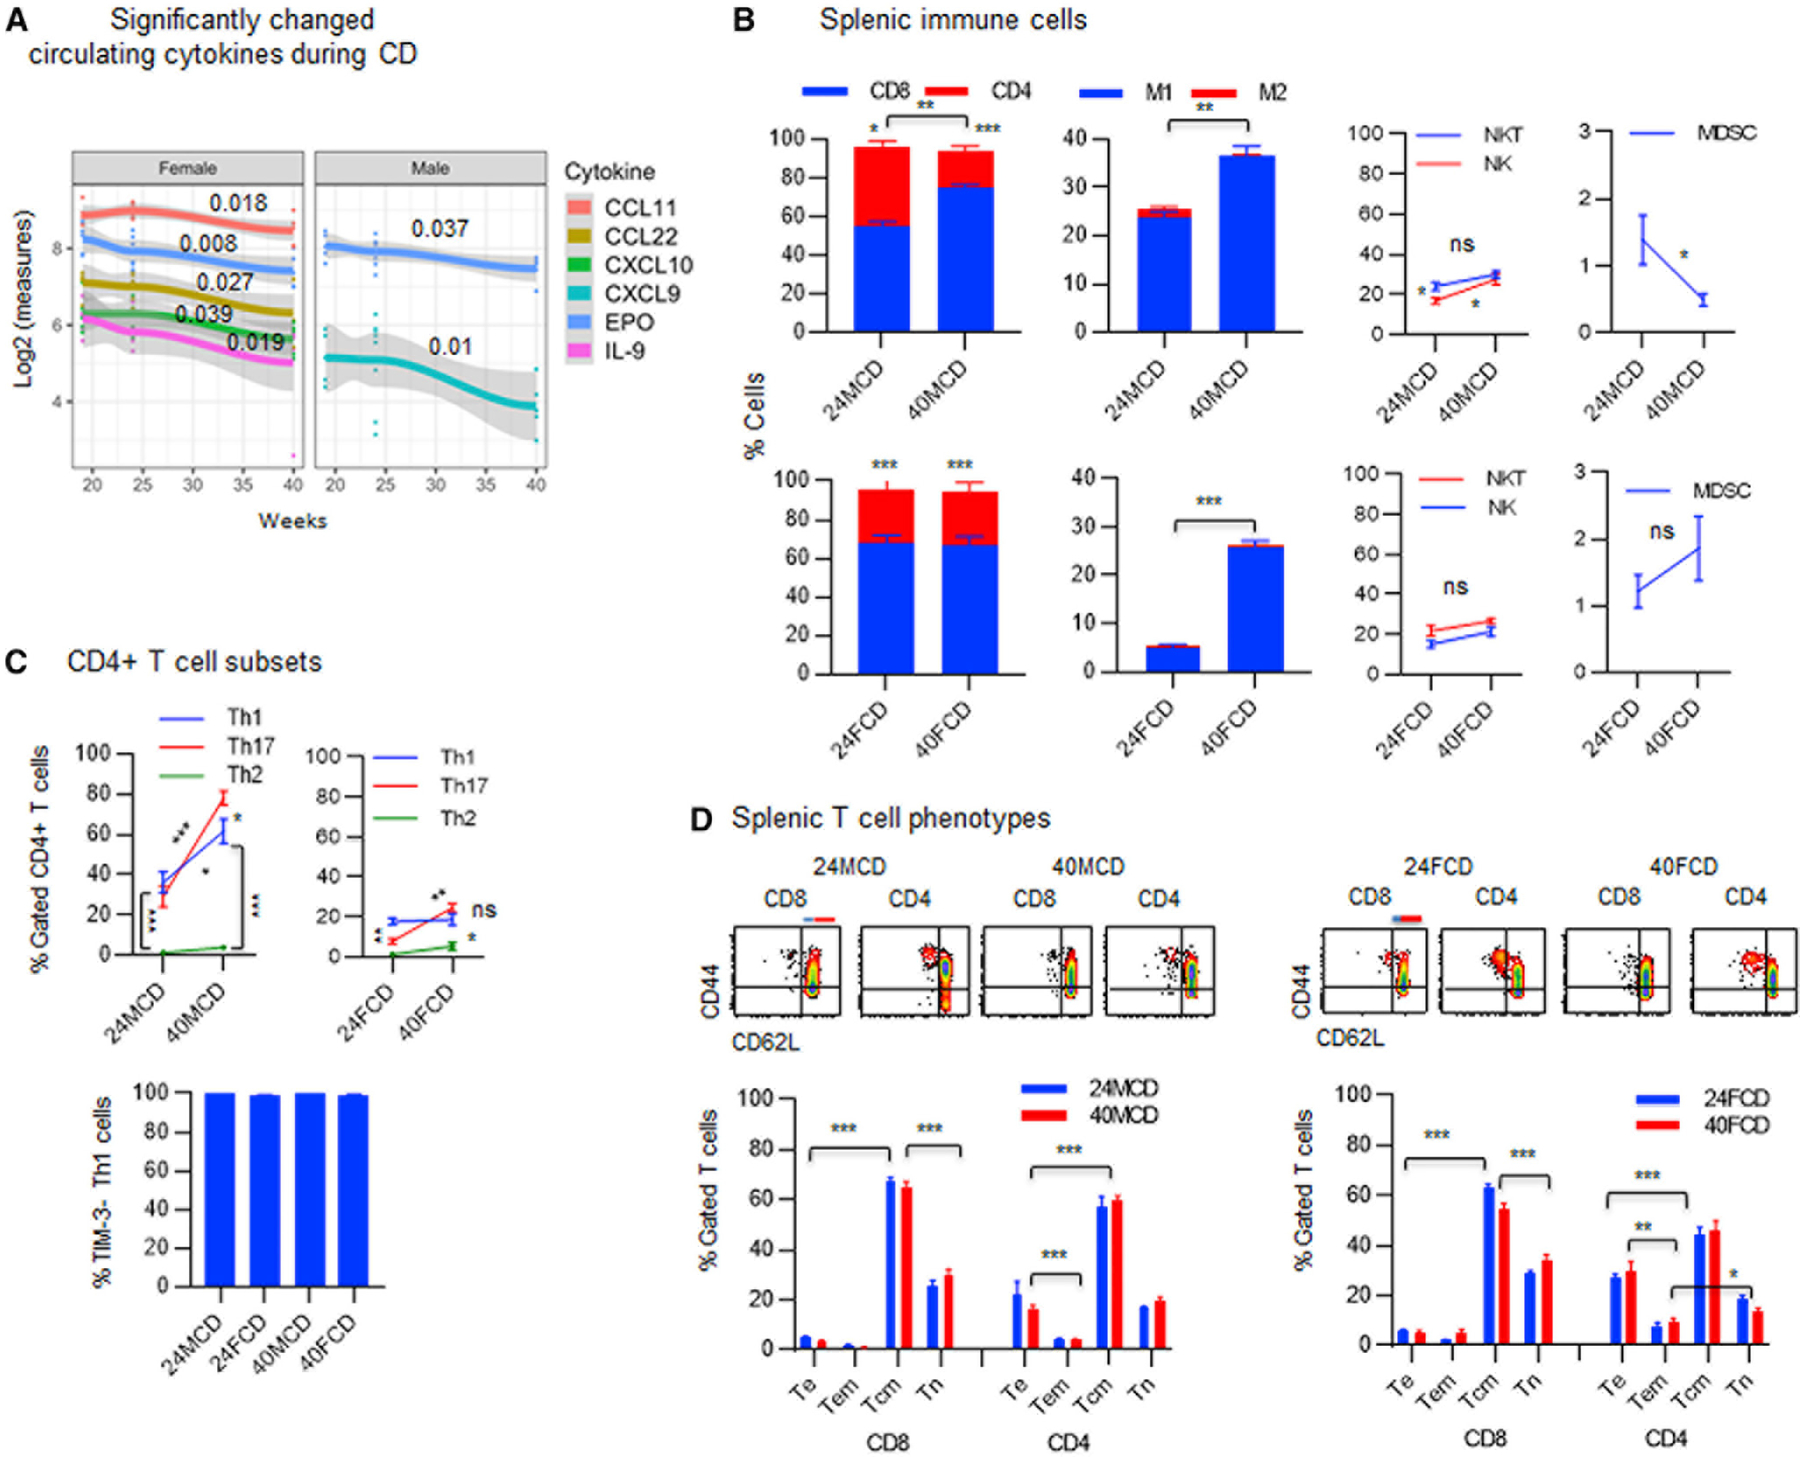
(A) Sera were collected from DIAMOND mice at weeks 19, 24, or 40 of being on a CD or WD three to five mice/group) and analyzed for 44 cytokines and chemokines in association with time using multivariate linear regression. The overall time trend, summarized across subjects, is presented for all cytokines and chemokines, which have a significant time trend during a CD. Data represent five to nine mice/group.
(B) FVS− viable splenocytes were gated for CD3+ T cells to show the proportion of CD8+ T cells and CD4+ T cells in males or females (three to five mice/group) being on a CD for 24 weeks (24MCD or 24FCD) and 40 weeks (40MCD or 40FCD) and were analyzed for M1 (F4/80+CD68+CD206−) and M2 macrophages (F4/80+CD68+/−CD206+), NK cells (CD3−CD4−CD8−CD49b+), NKT cells CD3+CD4−CD8−CD49b+), and CD11b+Gr1+ MDSCs.
(C) FVS− viable splenocytes gated for CD3+CD4+ T cells were analyzed for the percentage of Th1 (CXCR3+CCR5−), Th2 (CCR8+IL-3Ra−), or Th17 (CCR6+CD161−) cells: percentage of Th1 cells that do not express TIM-3 was determined.
(D) FVS− viable splenic CD8+ or CD4+ T cells were analyzed for percentage of T cell phenotypes, including Te (CD44+CD62L−), Tem (blue line, CD44+CD62Llow), Tcm (red line, CD44+CD62Lhigh), and Tn (CD44−CD62L+) cells.
Error bars are SEM.