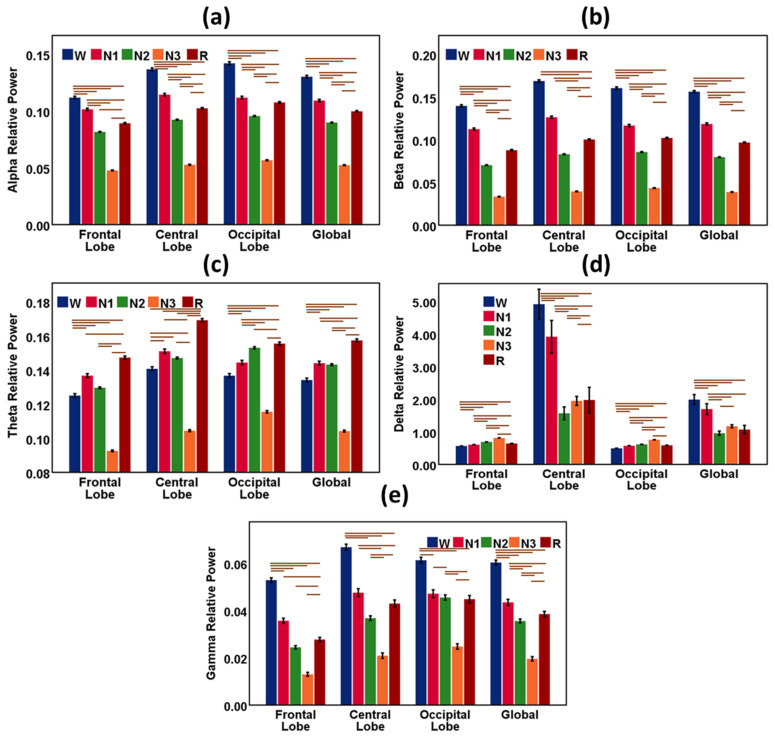
Figure 2.
Results from EEG spectral power features during sleep stages W, N1, N2, N-3, and R. The bar chart describes the relative mean power of the EEG waves, and the vertical error bar (black color) is the 95% CI. (a) Alpha relative power for sleep stages in the frontal lobe, central lobe, occipital lobe, and global. (b) Beta relative power for sleep stages in the frontal lobe, central lobe, occipital lobe, and global. (c) Theta relative power for sleep stages in the frontal lobe, central lobe, occipital lobe, and global. (d) Delta relative power for sleep stages in the frontal lobe, central lobe, occipital lobe, and global. (e) Gamma relative power for sleep stages in the frontal lobe, central lobe, occipital lobe, and global. Global indicates the average measures of features of the frontal, central, and occipital lobes. The horizontal bars (brown color) are the outcomes of the hypothesis tests and indicate significant differences (p < 0.05) in EEG features among the sleep stages.

