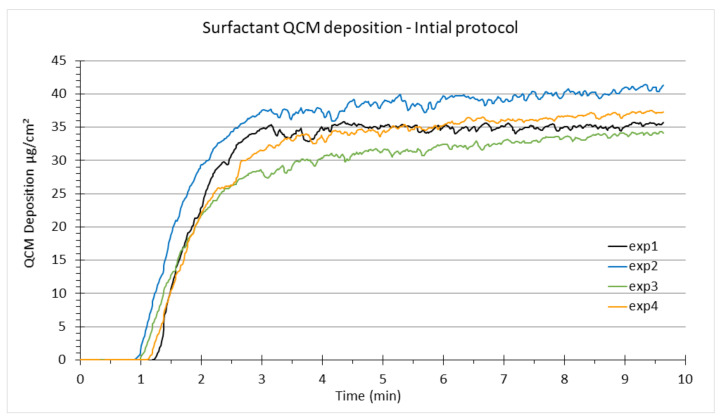
Figure 2.
QCM curves showing the cloud deposition of surfactant (qualitatively) in the VITROCELL® Cloud System. This Figure illustrates the reproducibility of the QCM response for independent exposures under the same conditions. An amount of 61 µL of whole porcine surfactant solution at 40 mg/mL was nebulized, and the VITROCELL® Cloud temperature was maintained at 37 °C. The nebulization starts between 30 s and 1 min after the start of data acquisition. Depicted are the four independent exposures performed in the present study before NP nebulization.

