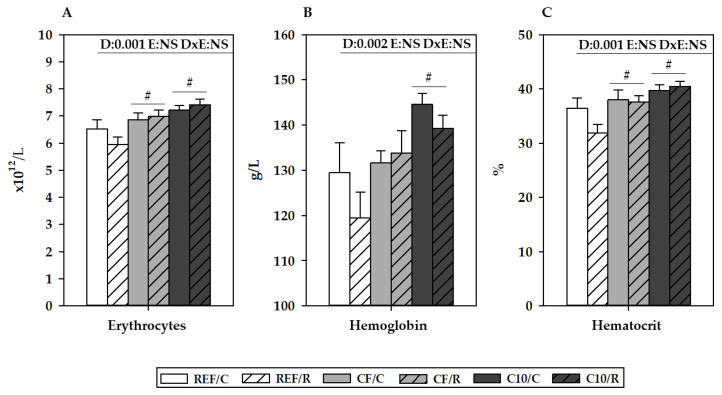
Figure 4.
Blood erythrocyte counts (A), hemoglobin concentration (B), and hematocrit (C) 16 h after performing the final exhaustion test. REF, reference diet; CF, 5% cocoa fiber-enriched diet; C10, 10% cocoa-enriched diet. The control (C) groups are represented by smooth bars, and the runner (R) groups are represented by striped bars. Data are expressed as mean ± SEM (n = 8). Statistical differences (two-way ANOVA followed by Tukey’s post-hoc test): # p < 0.05 vs. the REF diet.

