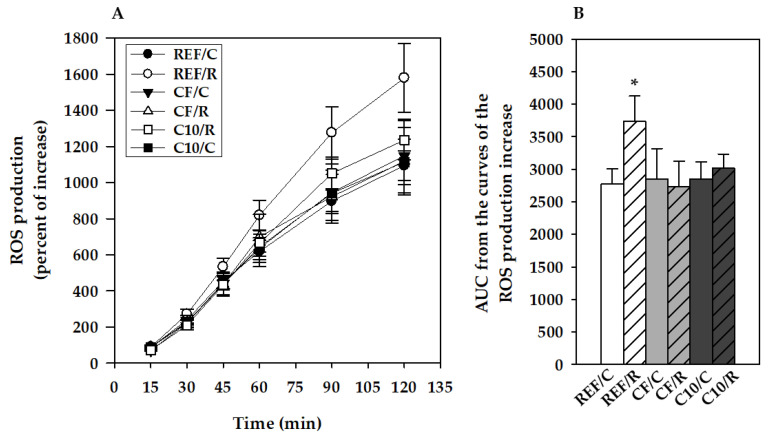
Figure 5.
Reactive oxygen species (ROS) production by peritoneal macrophages 16 h after performing the final exhausion test. (A) Kynetics of ROS production for 2 h; (B) Area under the curve (AUC) between 15–120 min. REF, reference diet; CF, 5% cocoa fiber-enriched diet; C10, 10% cocoa-enriched diet; C, control groups; R, runner groups. Data are expressed as mean ± SEM (n = 8). Statistical differences (a Kruskal–Wallis test followed by a Mann–Whitney U test): * p < 0.05 vs. the C group in the same diet.

