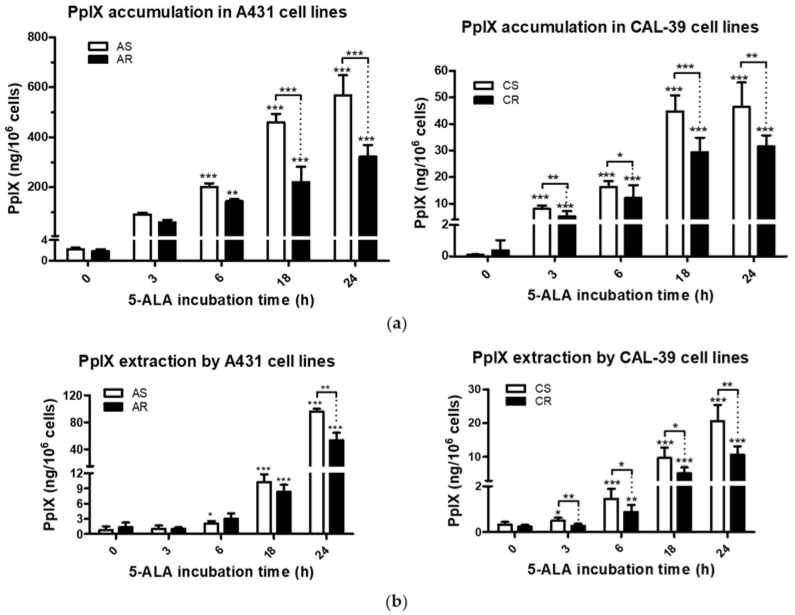
Figure 3.
PpIX accumulation and extraction. (a) PpIX levels in A-431 and CAL-39 cell lines. (b) PpIX levels in culture media collected from above A-431 and CAL-39 cells. The amount of PpIX was calculated from standard curve and presented in ng per 106 cells. Asterisks indicate statistical significance of differences between untreated cells and cells incubated with ALA for various periods of time, or the sensitive and resistant cells calculated by Student’s t-test (* p ≤ 0.05, ** p ≤ 0.01, *** p ≤ 0.001).

