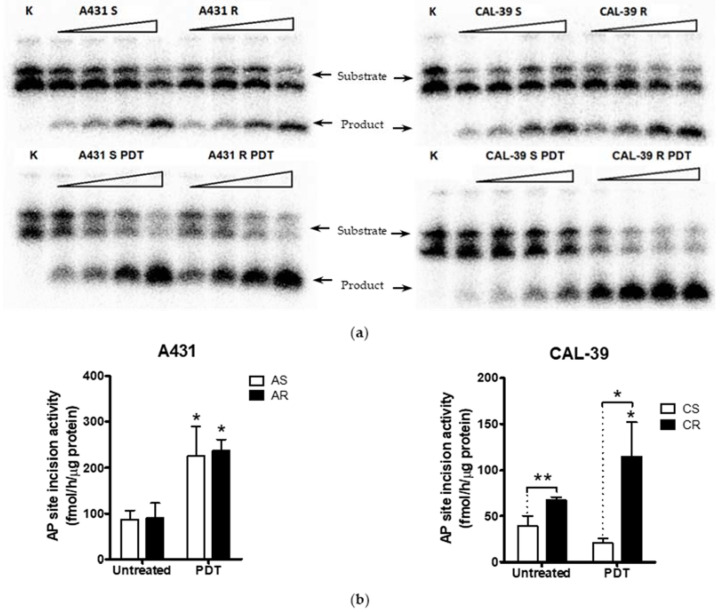
Figure 6.
APE1 endonuclease activity assay. (a) PhosphorImages of gels with separated products of reaction mediated by protein extracts isolated from the cells before and after PDT. (b) Quantification of APE1 endonuclease activity in A-431 and CAL39 cell lines. APE1 activity is expressed as fmol of product per hour per µg of protein extract isolated from the cells. Asterisks indicate statistical significance of differences between untreated cells and cells that were subjected to PDT, and between sensitive and resistant cells, calculated by the Mann–Whitney test (* p ≤ 0.05, ** p ≤ 0.01).

