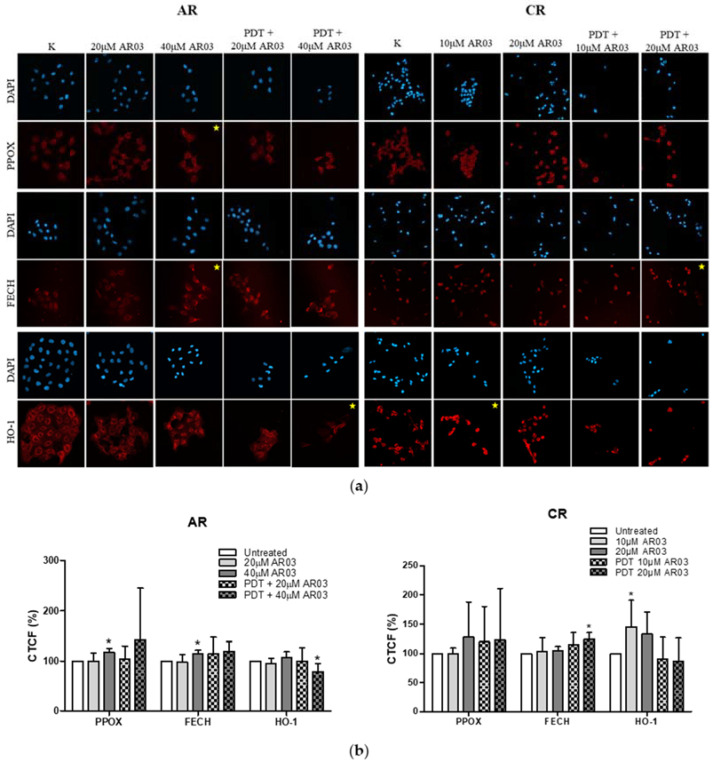
Figure 9.
Effect of AR03 on PPOX, FECH, and HO-1 levels. (a) Images of stained cells before treatment, after AR03 treatment, or after PDT combined with AR03 treatment. (b) Graphs with percentage values CTCF of untreated cells, resistant to PDT. Asterisks indicate the statistical significance of the differences between cells after treatment and untreated control calculated by the Mann–Whitney test (* p ≤ 0.05).

