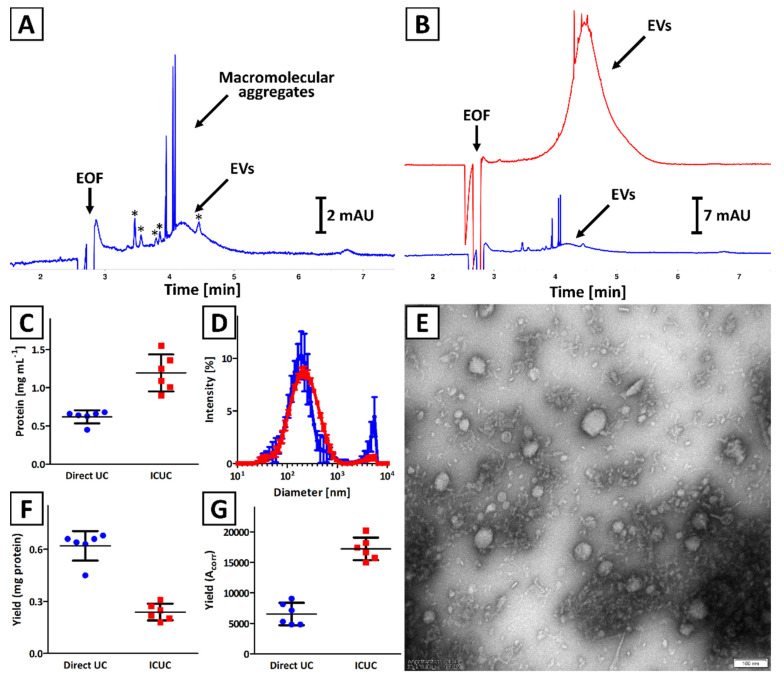
Figure 1.
Comparison of isolates obtained with (blue trace) direct UC and (red trace) ICUC methods. (A,B) CE analysis of exemplary isolates. Asterisks (*) indicate soluble impurities. (C) Total protein concentration was assessed with a BCA test. (D) DLS analysis of isolates. Error bars indicate the standard deviation (SD) of measurements performed for 3 independently obtained isolates. (E) TEM image of an isolate obtained with ICUC technique. The size bar is equal to 100 nm. (F) Isolation yield is expressed as total protein content. (G) Isolation yield calculated based on CE analyses results (Acorr) using Equation (2). Bars (C,F,G) represent the mean and SD calculated for 6 independently obtained isolates.

