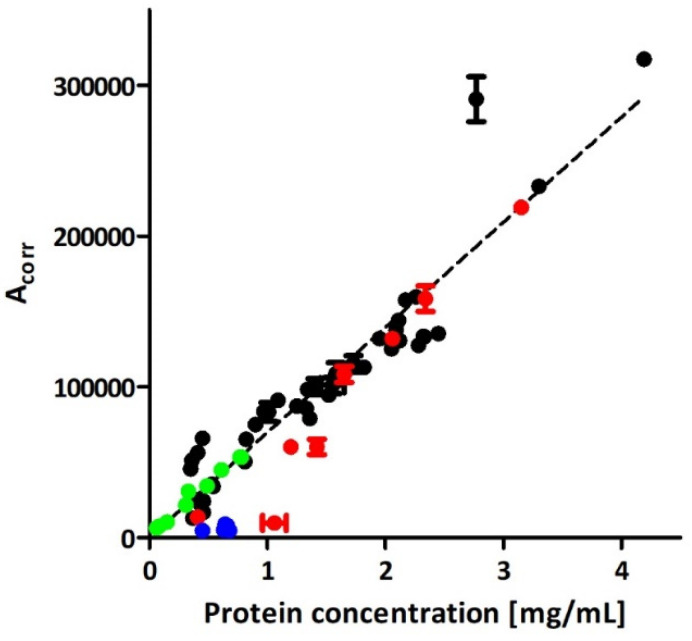
Figure 2.
Comparison of EVs quantitation with CE and BCA in isolates obtained with direct UC (blue trace), ICUC (black and red traces), and IDGUC (green trace) methods. The red trace represents isolates that, based on the CE analysis, were considered impure (comment in Section 3). The linear curve was plotted based on the quantitative data obtained for 42 independent isolates, achieved with the ICUC method (black trace). Error bars represent the SD of two measurements.

