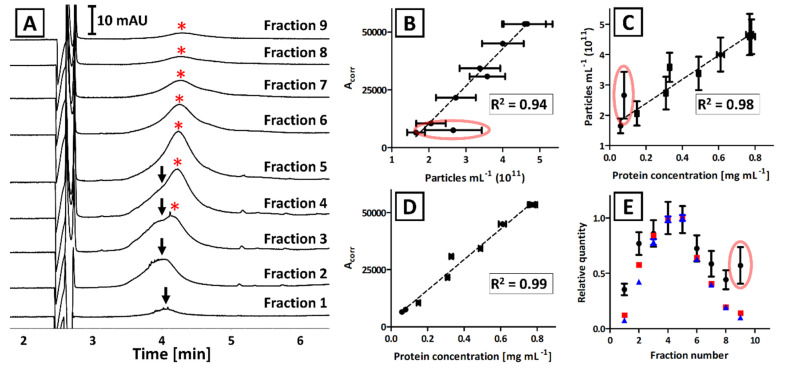
Figure 4.
The analysis results of isolates that were obtained from GFP-modified Pectobacterium odoriferum Car1 with IDGUC. (A) CE analysis of certain fractions. Arrows and asterisks (*) indicate signals generated by two subpopulations of EVs. (B–E) Comparison of CE, NTA, and BCA analyses of separated fractions. Error bars represent the standard deviation of measurements. Coefficients of determination (R2) refer to the linear correlation between certain analyses and do not include the outlier (circled in red). (E) The traces correspond to the relative quantity of EVs determined with CE (red), BCA (blue), and NTA (black) in certain fractions.

