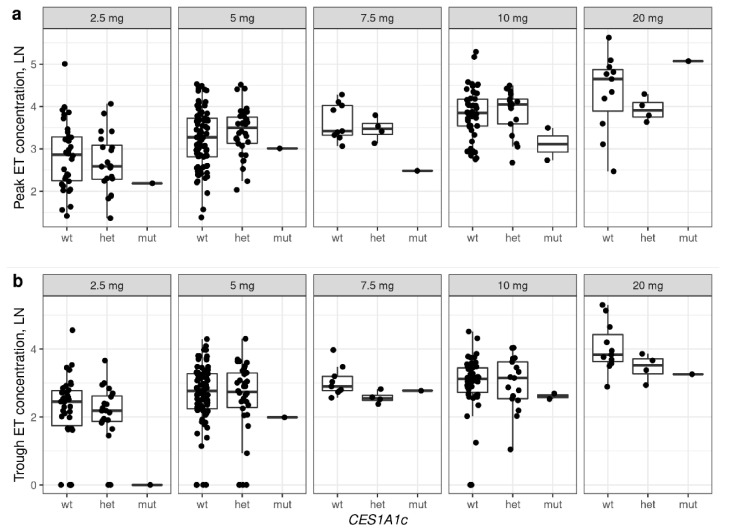
Figure 2.
Peak (a) and trough (b) concentrations of enalaprilat, based on CES1A1c genotypes in patients receiving different doses of enalapril. The figure shows concentrations for which there was at least one observation for each genotype. ET—enalaprilat. WT—wild-type homozygous, wild-type heterozygous (WT/CES1A1c), mut—CES1A1c homozygous (CES1A1c/CES1A1c). Ln—natural logarithm.

