Figure 3.
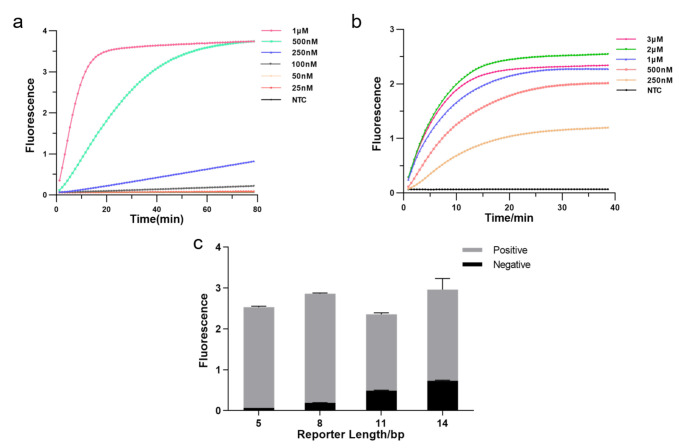
Optimizing the RPA-CRISPR reaction system. (a) Real-time fluorescence curves based RPA-CRISPR/Cas12a at different Cas12a protein concentrations. NTC: no template control. (b) Real-time fluorescence curves based RPA-CRISPR/Cas12a at different CrRNA concentrations. (c) Optimization of the FQ reporter length for the CRISPR detection. Various lengths (5, 8, 11, 14 bp) of FQ ssDNA reporter were tested to avoid false-positive results (n = 3, error bars showed mean with SD).

