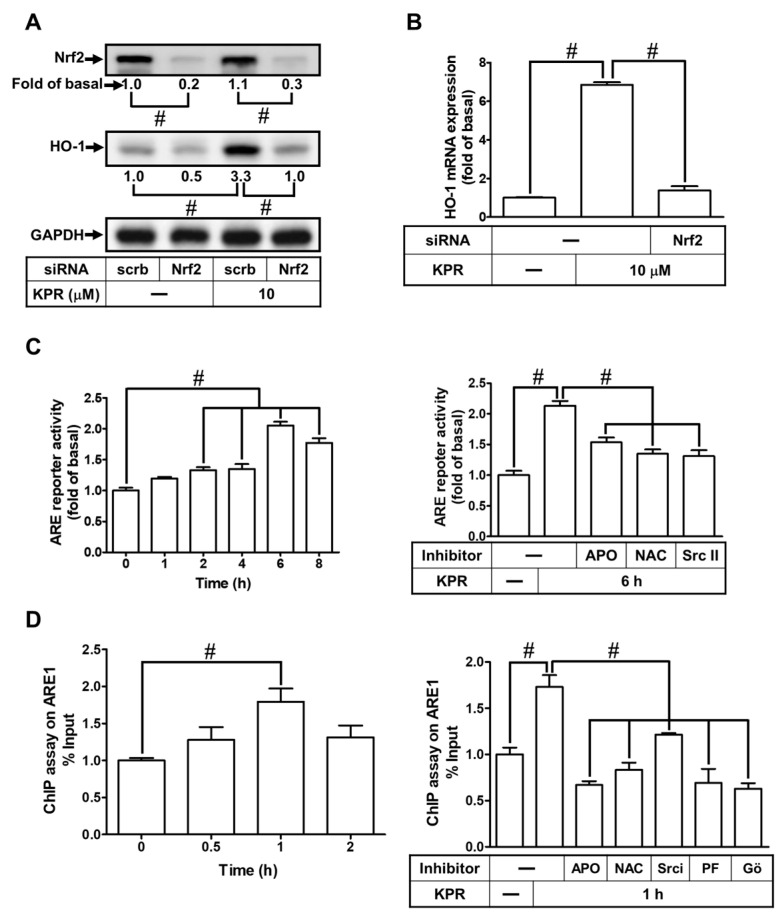
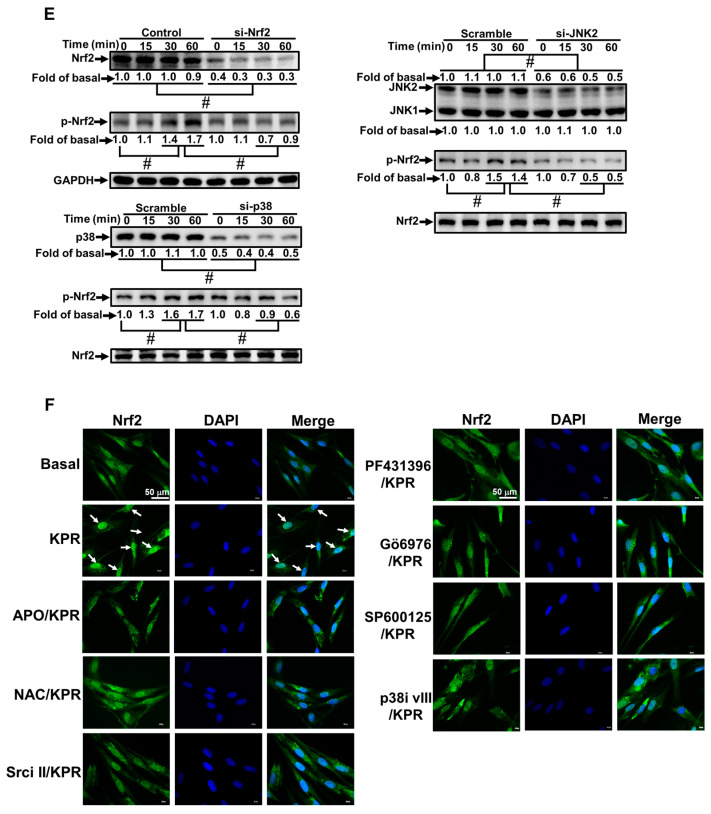
Figure 10.
Nrf2 activated by protein kinases is involved in KPR-induced HO-1 expression. (A) HPAEpiCs were transfected with scrambled (scrb) or Nrf2 siRNA, and then incubated with DMSO or KPR (10 μM) for 16 h. The protein expression of HO-1 was determined by Western blot analysis using GAPDH as a loading control. (B) Cells were transfected with scrambled (scrb) or Nrf2 siRNA, and then incubated with DMSO or KPR (10 μM) for 6 h. The HO-1 mRNA expression was analyzed by real-time PCR. (C) HPAEpiCs were co-transfected with ARE promoter-Luc gene and β-galactosidase and then incubated with KPR (10 μM) for the indicated time intervals. The levels of Nrf2 binding with ARE were examined by a luciferase reporter assay kit. Cells were pretreated with APO (100 μM), NAC (1 mM), or Srci II (10 μM) for 1 h and then incubated with KPR (10 μM) for 6 h. ARE promoter activity was determined by a luciferase reporter assay kit. (D) Cells were incubated with KPR (10 μM) for the indicated time intervals (upper). The cells were pretreated with APO (100 μM), NAC (1 mM), Srci II (10 μM), PF431396 (10 μM), or Gő6976 (3 μM) for 1 h, and then incubated with KPR (10 μM) for 1 h (bottom). The DNA binding activity of Nrf2 on ARE1 was determined by chromatin immunoprecipitation assay. The immunoprecipitated DNA was analyzed by real-time qPCR with SYBR Green. (E) Cells were transfected with scrambled (scrb), p38, JNK2, or Nrf2 siRNA, and then incubated with KPR (10 μM) for the indicated time intervals. The levels of phospho-Nrf2, total Nrf2, p38, and JNK2 were determined by Western blot. (F) The cells were pretreated without or with APO (100 μM), NAC (1 mM), Srci II (10 μM), PF431396 (10 μM), Gő6976 (3 μM), SP600125 (10 μM), or p38i VIII (10 μM) for 1 h, and then incubated with KPR (10 μM) for 30 min. The localization and expression of Nrf2 were determined by immunofluorescent staining (green) and nuclei were stained with DAPI (blue). Scale bar: 50 µm. Data are expressed as mean ± SEM (n = 5), analyzed with one way ANOVA and Dunnett’s post hoc test. # p < 0.01, as compared with the cells exposed to vehicle alone; or significantly different as indicated.


