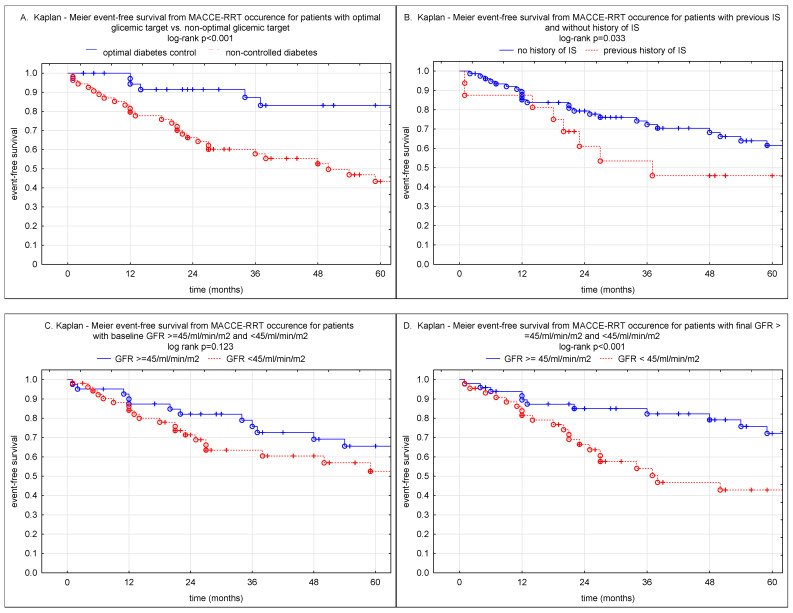
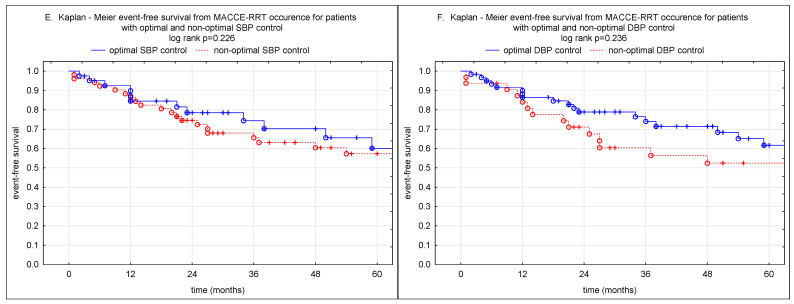
Figure 2.
The Kaplan-Meier plot depicts survival after renal artery stenting for parameters associated with outcome. (A) patients with maintained glycemic target goals (continuous blue line) and patients with non-optimal diabetic control (discontinuous red line). (B) patients with previous stroke (discontinuous red line) and non-stroke (continuous blue line). (C) patients with baseline eGFR ≥ 45 mL/min/m2 (continuous blue line) and the eGFR < 45 mL/min/m2 (discontinuous red line). (D) patients with final, post intervention, eGFR ≥ 45 mL/min/m2 (continuous blue line) and the eGFR < 45 mL/min/m2 (discontinuous red line). (E) patients with optimal target goals of SBP after PTA (continuous blue line) and patients with non-optimal SBP control (discontinuous red line). (F) patients with optimal target goals of DBP after PTA (continuous blue line) and patients with non-optimal DBP control (red discontinuous line). Ticks along the lines represent censored cases. The log-rank test p-value between the two groups is presented in each figure.


