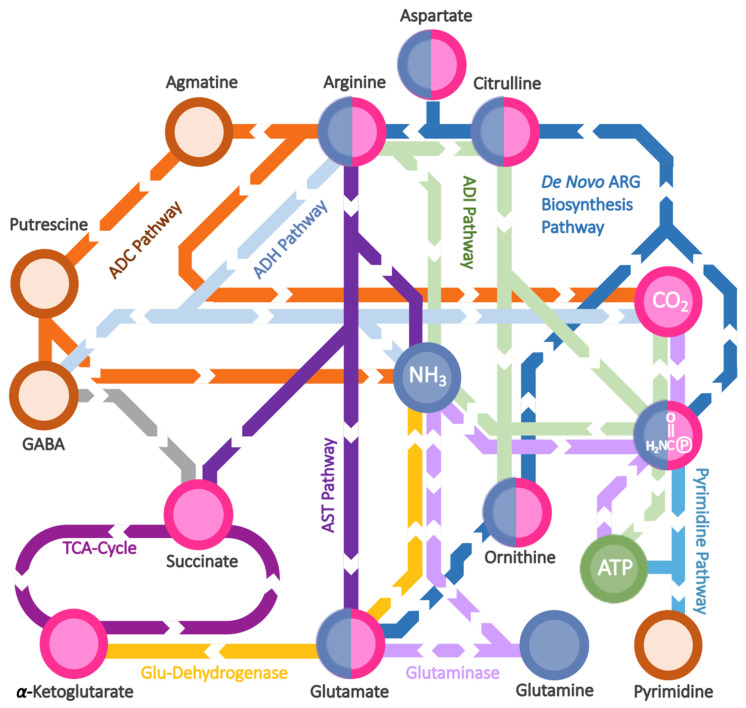
Figure 1.
L-Arginine metabolism in Pseudomonas aeruginosa in a metro-style map. Nodes represent the most relevant metabolite(s) while different colors represent different metabolic categories. Each route represents the metabolic pathway named in the Figure with the same color, linking different nodes. The color code used for the nodes: (i) magenta and light navy nodes for C and N source metabolites, respectively; (ii) green for energy production; (iii) rust orange for other N metabolites. 2NHCO℗: carbamoyl phosphate.

