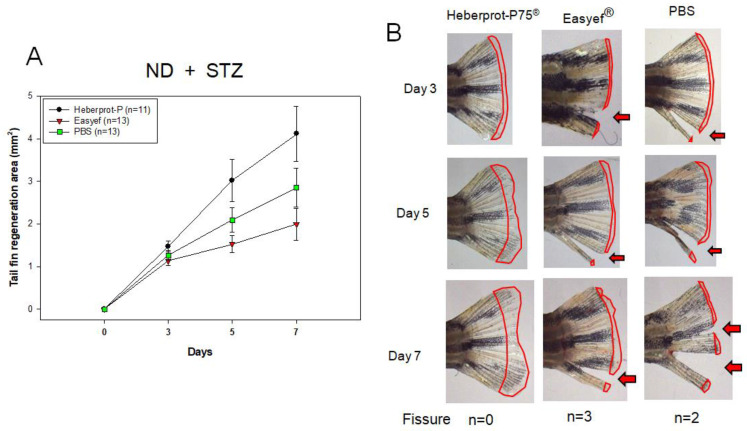
Figure 6.
Comparison of tissue regeneration speed (A) and morphology (B) in the tail fin area under diabetic conditions and ND consumption over seven days. The red arrow indicated the fissure of the tail. At the bottom of the photos, n indicates the number of zebrafish that showed fissure of the tail fin on day 7. ND, normal diet.

