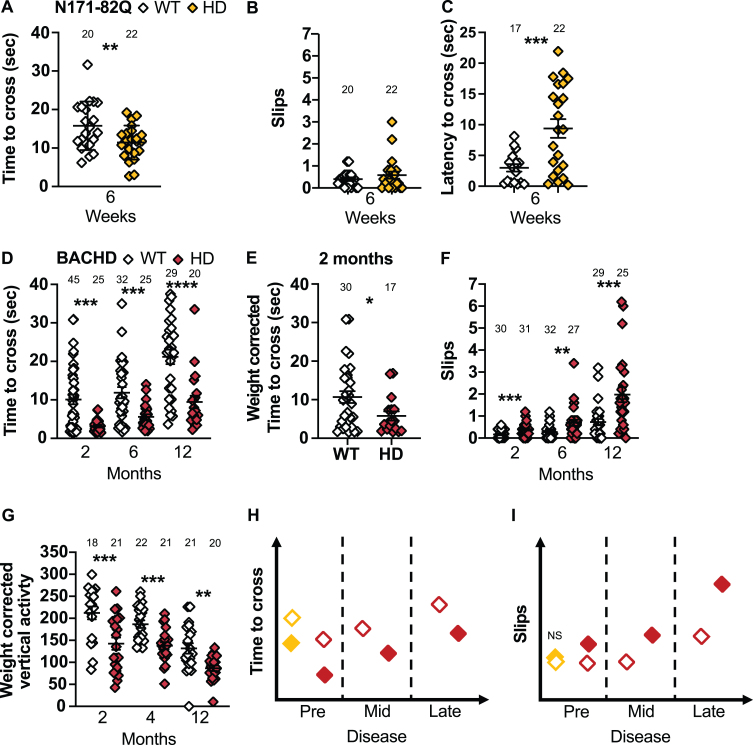
Fig. 6.
N171-82Q and BACHD mice perform differently on the narrow beam and climbing test. A) N171-82Q and BACHD mice cross the narrow beam faster early in the disease (t = 2.607, p = 0.006). The number of slips on the narrow beam do not differ in N171-82Q mice but they take longer to start to cross the beam (tw = 3.915, p = 0.0003) (B, C). D) BACHD mice cross the narrow beam faster throughout the disease (2 months: MWU = 446, p = 0.004, 6 months: MWU = 268, p = 0.006, 12 months: t = 4.440, p < 0.0001) (D) including after weight correction (2 months: MWU = 170, p = 0.03) (E). F) BACHD mice also slip more frequently while crossing the narrow beam (2 months: MWU = 241, p = 0.0003; 6 months: MWU = 239, p = 0.001; 12 months: MWU = 163, p = 0.0002). G) BACHD mice are also less active vertically (frequency of rearing and climbing) than WT mice during the climbing test (2 months: t = 3.465, p = 0.0007; 4 months: t = 4.077, p = 0.0001; 12 months: tw = 3.878, p = 0.001). Representative models of the time to cross and slips on the narrow beam as the disease progresses (H, I). All comparisons are made to WT mice of the same background. Sample sizes are presented for each group. HD, Huntington’s disease carrier; NS, non-significant; WT, wild-type. Data represent mean ± SEM. *p ≤ 0.05, **p ≤ 0.01, ***p ≤ 0.001, and ****p ≤ 0.001 indicates a significant difference by Student’s t-test with or without Welch’s correction or Mann Whitney test for each time point.

