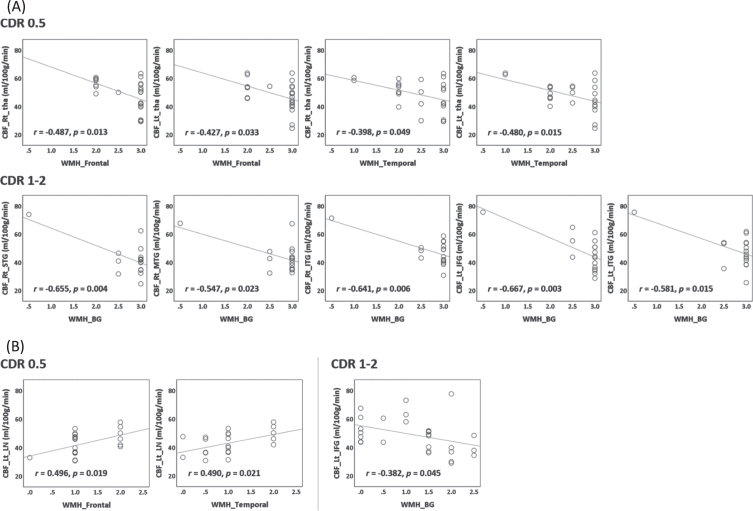
Fig. 4.
Correlation between cerebral blood flow (CBF) and white matter hyperintensities (WMH). Subplots (A) and (B) show subcortical ischemic vascular disease (SIVD) and Alzheimer’s disease (AD), respectively. Each circle is a patient. The Pearson’s correlation coefficient (r) and linear regression line are shown. Rt, right; Lt, left; tha, thalamus; BG, basal ganglia; LN, lentiform nucleus; STG, superior temporal gyrus; MTG, middle temporal gyrus; ITG, inferior temporal gyrus; IFG, inferior frontal gyrus; CDR, Clinical Dementia Rating.

