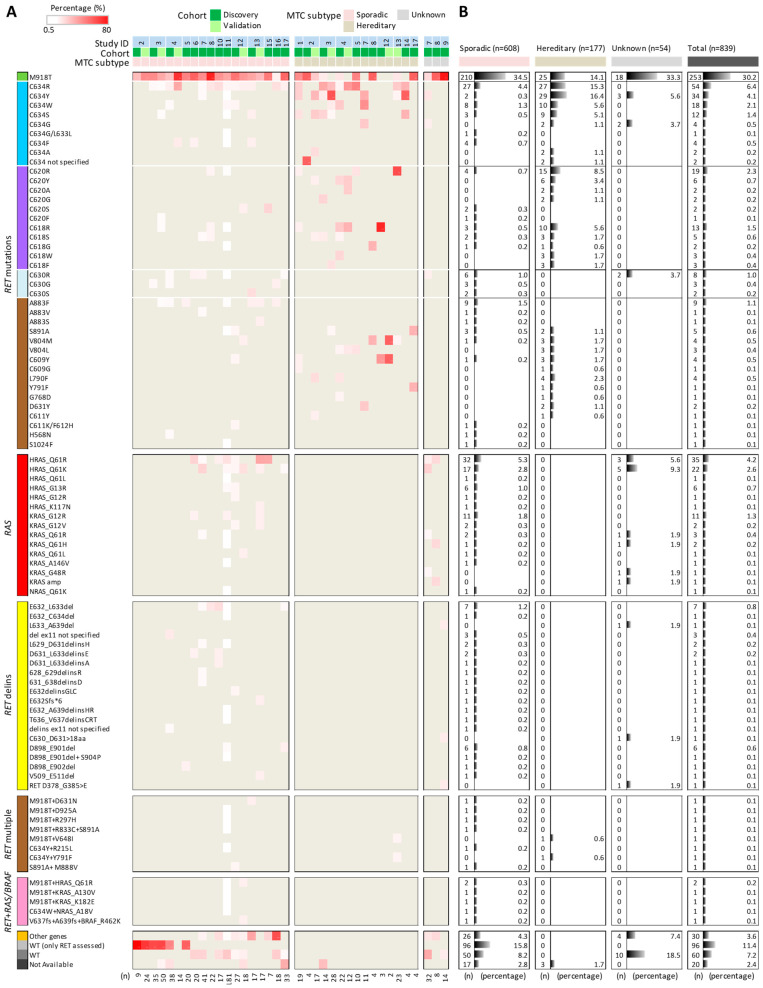
Figure 1.
Meta-analysis of MTC patient mutational spectrum. (A) Mutation types identified in the 37 MTC cohorts derived from the 17 studies reported in Table 1. Cohorts are ordered based on MTC subtype and study. Heatmap shows the percentage of positive samples for the specific mutation in each cohort; the total number of samples (n) composing each cohort is at the bottom. For our series (study 17), the original cohort of 37 MTCs was considered. (B) Frequencies of the corresponding mutations in the specific MTC subtypes and in the whole set (total); the total number of mutation-positive patients (n) and their percentage are shown.

