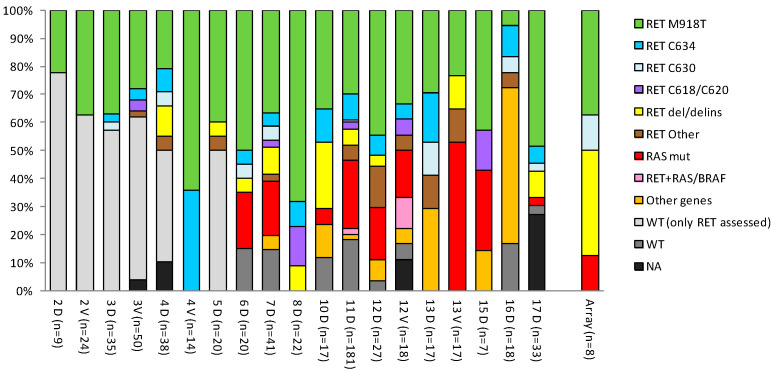
Figure 3.
Mutational spectrum in sporadic MTC cohorts. The percentage of the mutations reported in each MTC sporadic cohort is shown; cohorts are identified by the corresponding study ID (see Table 1) and the discovery (D) or validation (V) set type. The number of samples (n) in each cohort is in parentheses. The “Array” bar represents the eight patients described in Table 2 selected from a larger cohort (study 17). The RET Other class includes both mutations in less frequent codons and multiple co-occurring RET mutations.

