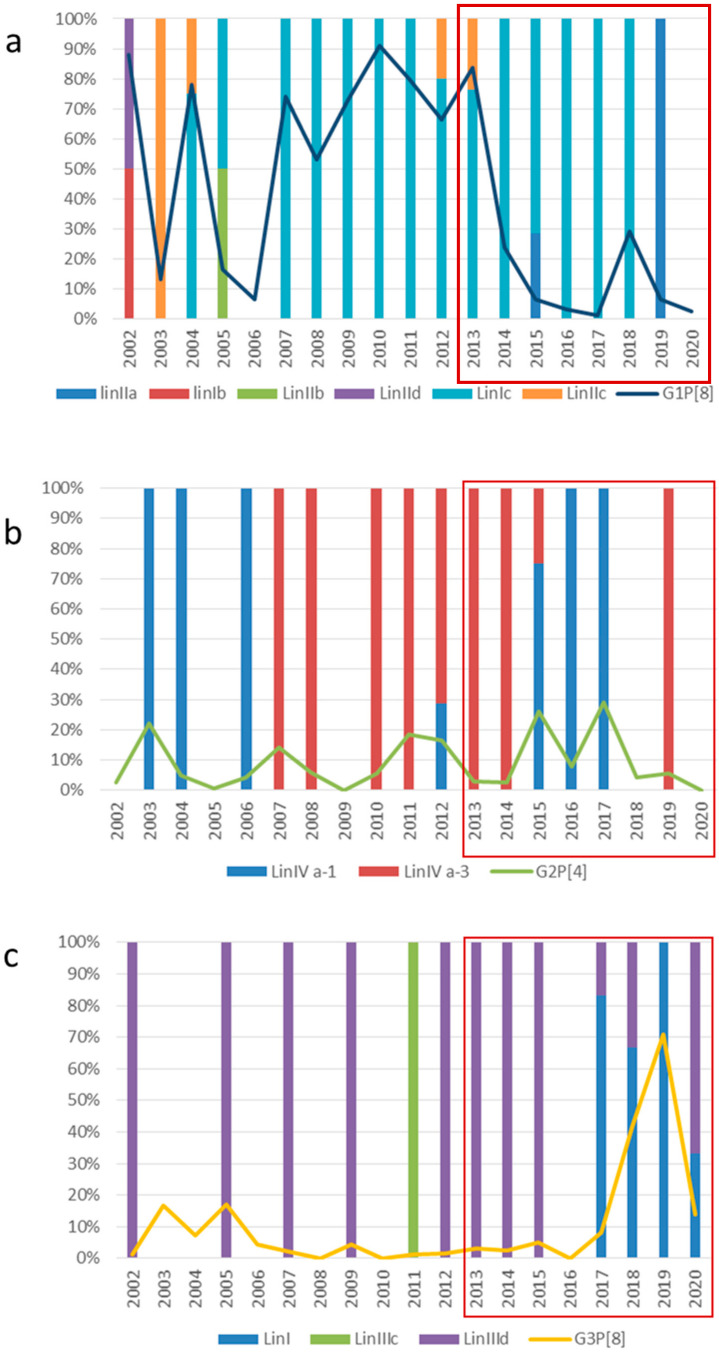
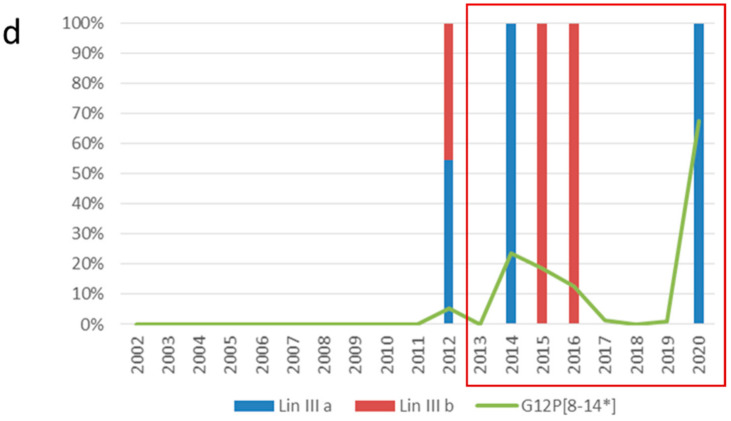
Figure 3.
Temporal distribution over the study period of VP7 lineages and sublineages of Rotavirus G1P[8] (a), G2P[4] (b), G3P[8] (c), and G12P[8] (d). Overlaid lines show the prevalence rate of each genotype and the post-vaccine period (2013–2020) is highlighted in the box. * The G12 RV was detect in association with P[8] or P[14] genotype.


