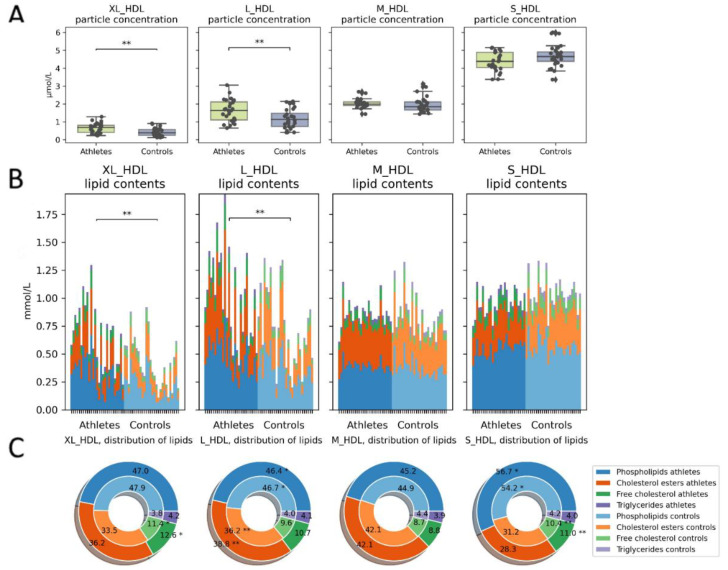
Figure 6.
HDL particle concentrations and contents. (A) Total particle concentrations and (B) absolute lipid concentrations in the particles. Athletes had more large to very large HDL particles and consequently more lipids contained within them. (C) Relative proportions of lipids: the outer donut chart represents the athletes, and the inner represents controls. The athletes had a smaller phospholipid/cholesterol ratio in the large particles than the controls did. Kruskal–Wallis p value: * < 0.05, ** < 0.01.

