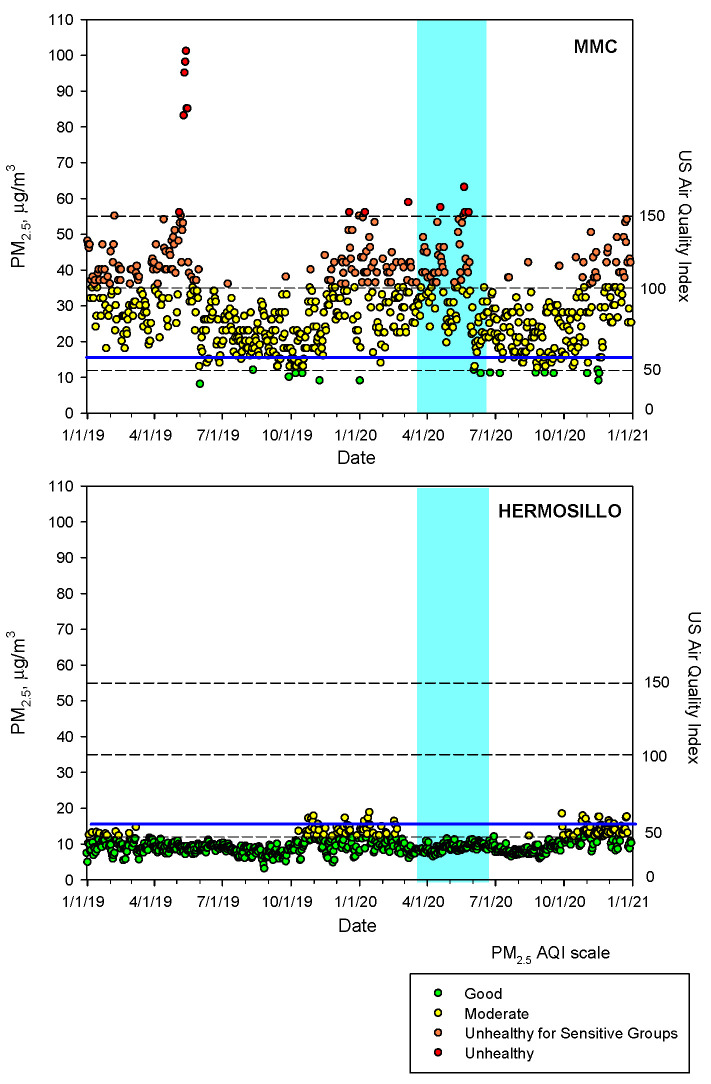
Figure 3.
Time-series of maxima PM2.5 24-h averages at MMC and daily means of PM2.5 in Hermosillo from 1 January 2019 to 31 December 2020 following the US EPA AQI index. The blue continuous line depicts the revised 24-h average guideline of the WHO. The blue shade area represents the official lockdown COVID-period in Mexico. Air quality data are available from Sistema de Monitoreo Atmosferico del Gobierno de la Ciudad de México (http://www.aire.cdmx.gob.mx/default.php accessed on 18 December 2021) and from Red Universitaria de Observatorios Atmosféricos de la Universidad Nacional Autónoma de México (https://www.ruoa.unam.mx/ accessed on 18 December 2021).

