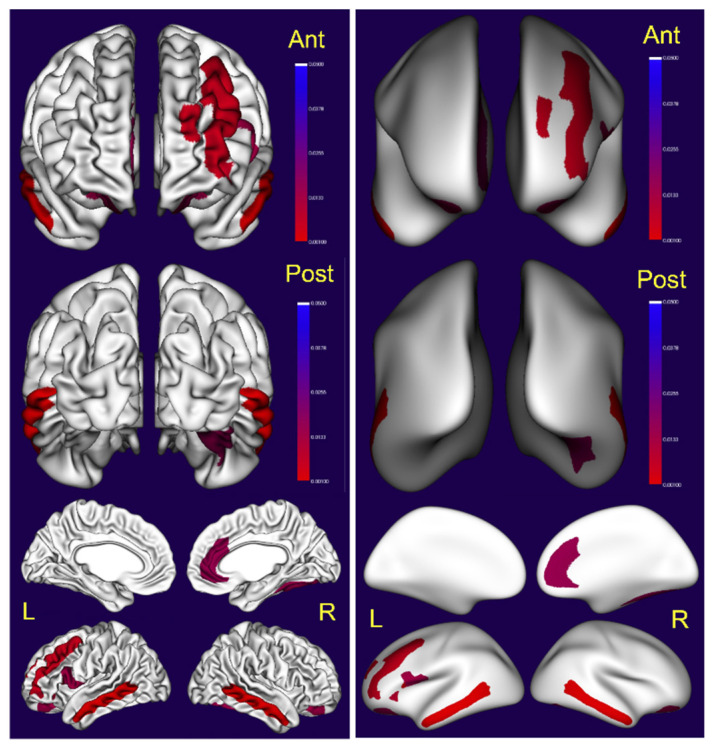
Figure 5.
Visualization of the statistical significance of surface area measurements in cortical regions (left). On the right, the inflated surface. Non-significant regions are in white, significant regions (following correction for multiple comparison) are shown in blue (p < 0.05) to red (p < 0.001).

