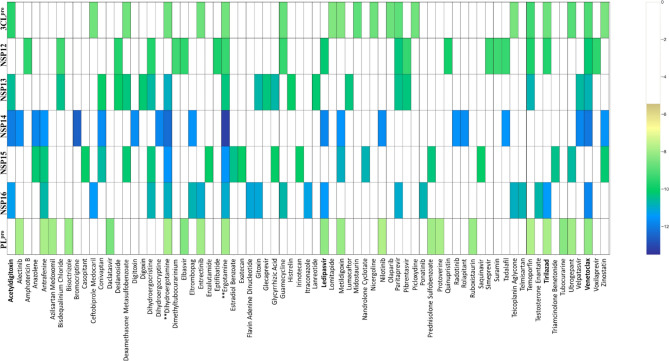
Figure 4.
The distribution of docking scores of different drug molecules with seven selected SARS-CoV-2 drug targets. The drugs are shown in X-axis and the proteins are shown in Y-axis. The yellow-green color spectrum shows increasing binding affinity. The drug molecules which has less than − 6 kcal/mol or no docking score are represented with white space in corresponding proteins. The four selected drugs are highlighted in boldface.

