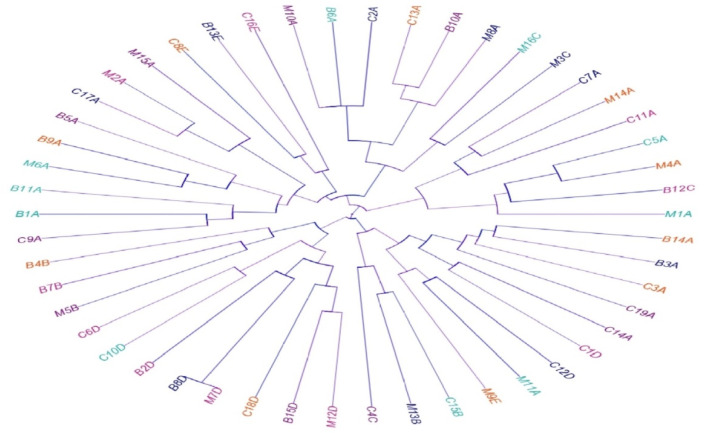
Figure 4.
Dendrogram showing the relatedness of C. perfringens isolated from beef (B), chicken meat (C), and milk (M) samples as determined by the antimicrobial resistance and toxin gene profiles. The C. perfringens toxinotypes are indicated with different colors in the dendrogram to denote the specificity of various toxinotypes.

